 6
6peptides
spectra
0.707 | 0.789
0.000 | 0.000
0.058 | 0.163
0.043 | 0.161
0.000 | 0.000
0.000 | 0.087
0.000 | 0.000
0.000 | 0.000
| Plot | Mito | Lyso | Perox | ER | Golgi | PM | Cytosol | Nucleus | |||||
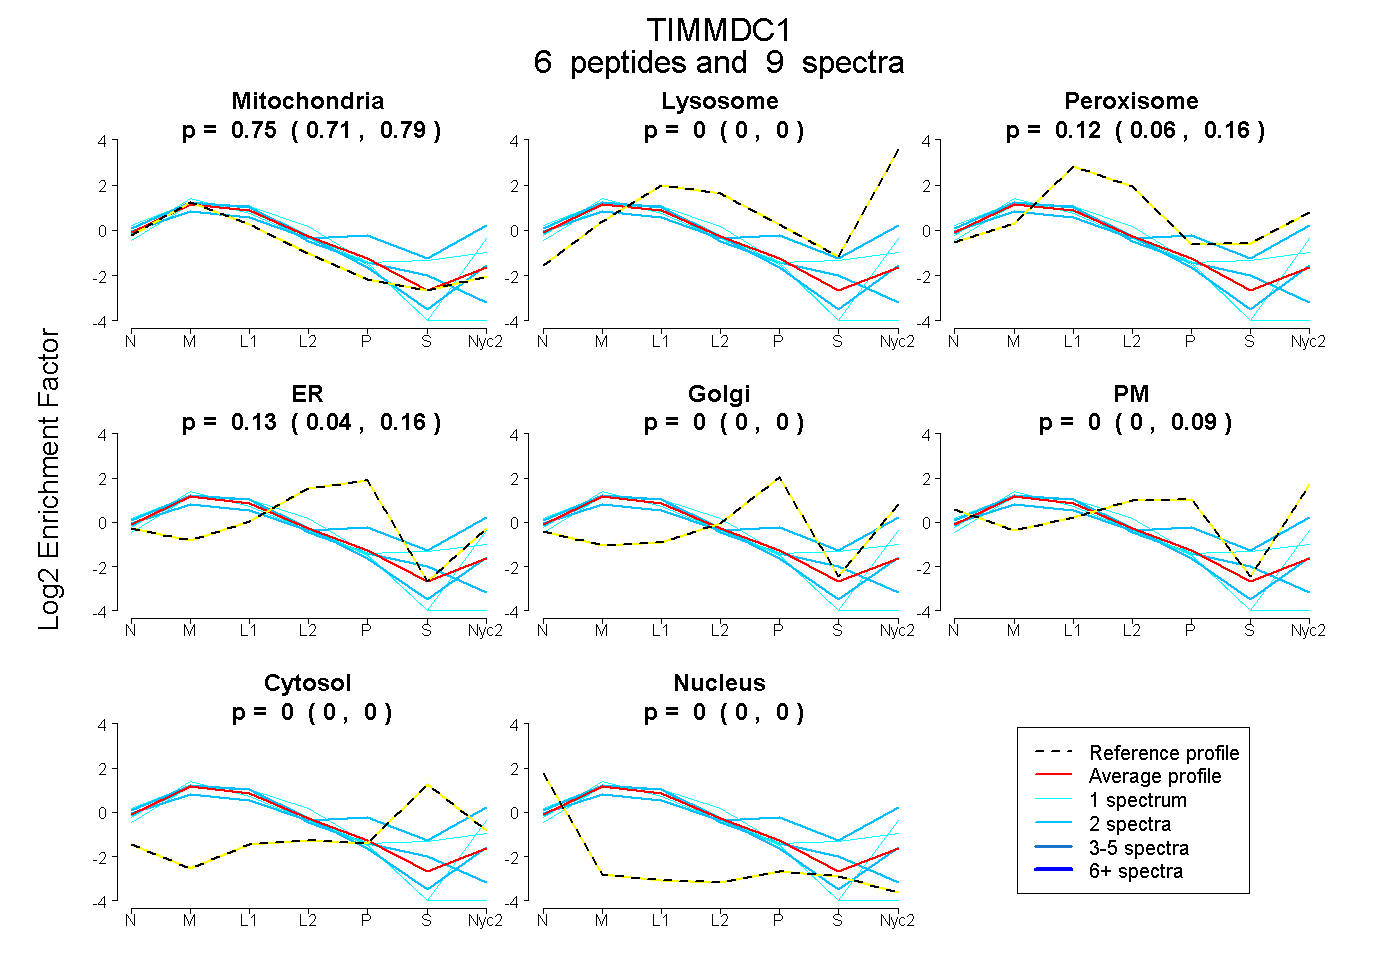
| Expt A |
6 peptides |
9 spectra |
|
0.750 0.707 | 0.789 |
0.000 0.000 | 0.000 |
0.119 0.058 | 0.163 |
0.131 0.043 | 0.161 |
0.000 0.000 | 0.000 |
0.000 0.000 | 0.087 |
0.000 0.000 | 0.000 |
0.000 0.000 | 0.000 |
| 2 spectra, YIEQSQAEIYHNR | 0.392 | 0.159 | 0.097 | 0.000 | 0.093 | 0.180 | 0.079 | 0.000 | ||
| 1 spectrum, NLQVTELLPMEIESGLEK | 0.567 | 0.000 | 0.393 | 0.000 | 0.000 | 0.000 | 0.040 | 0.000 | ||
| 2 spectra, SYVSDPGSSESGWDR | 0.818 | 0.000 | 0.055 | 0.059 | 0.000 | 0.068 | 0.000 | 0.000 | ||
| 2 spectra, EMDYICR | 0.892 | 0.000 | 0.075 | 0.034 | 0.000 | 0.000 | 0.000 | 0.000 | ||
| 1 spectrum, INIGLR | 0.681 | 0.025 | 0.000 | 0.000 | 0.000 | 0.294 | 0.000 | 0.000 | ||
| 1 spectrum, HCGETVQER | 0.979 | 0.000 | 0.000 | 0.021 | 0.000 | 0.000 | 0.000 | 0.000 |
| Plot | Lyso | Other | |||||||||||
| Expt C |
7 peptides |
25 spectra |
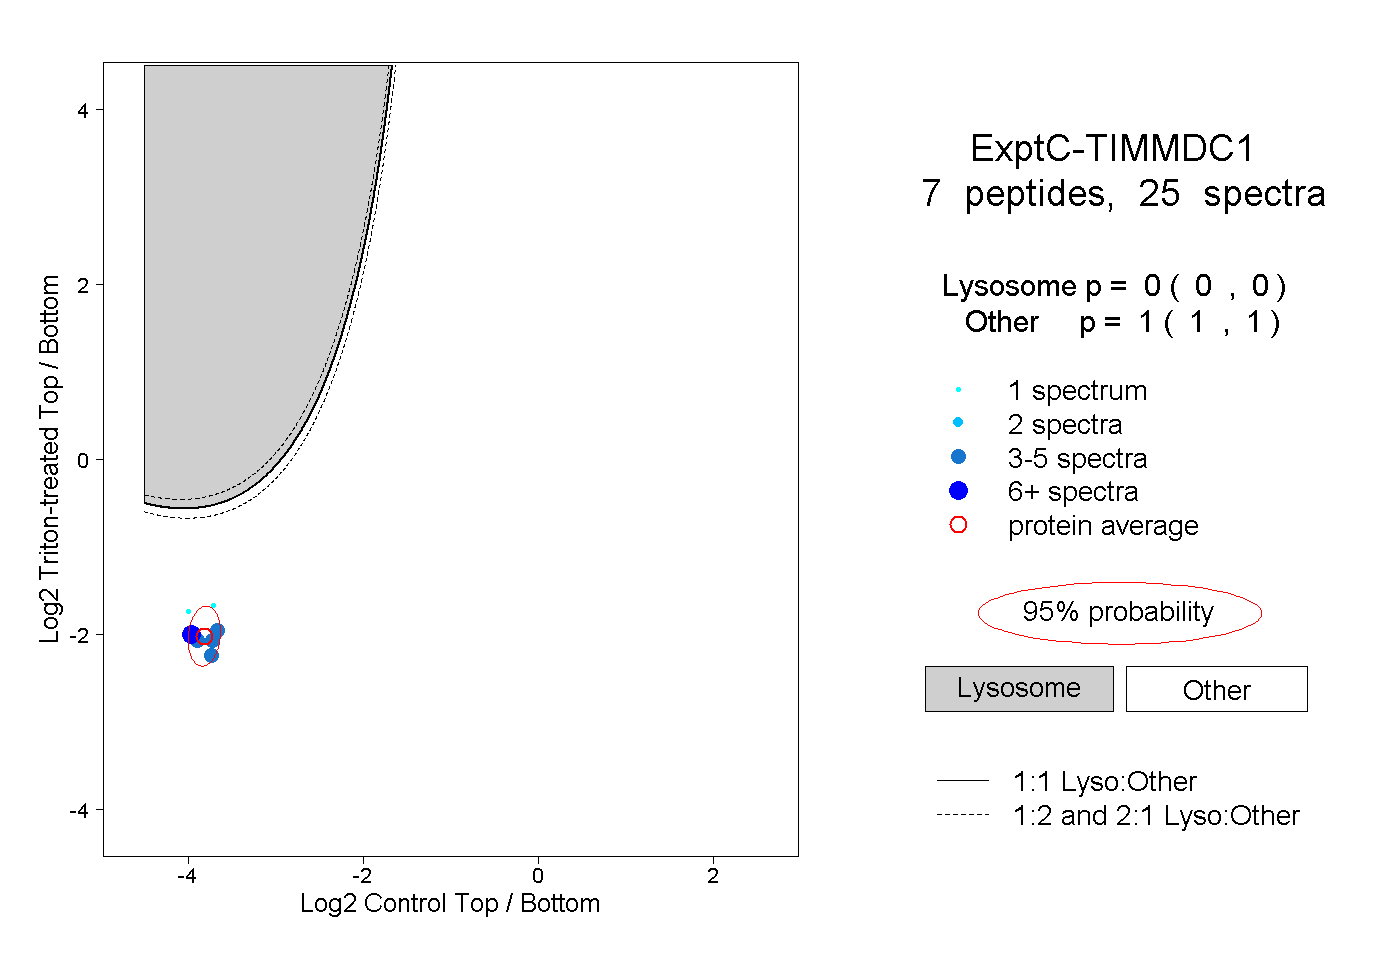 |
0.000 0.000 | 0.000 |
1.000 1.000 | 1.000 |
||||||||
| Plot | Lyso | Other | |||||||||||
| Expt D |
1 peptide |
1 spectrum |
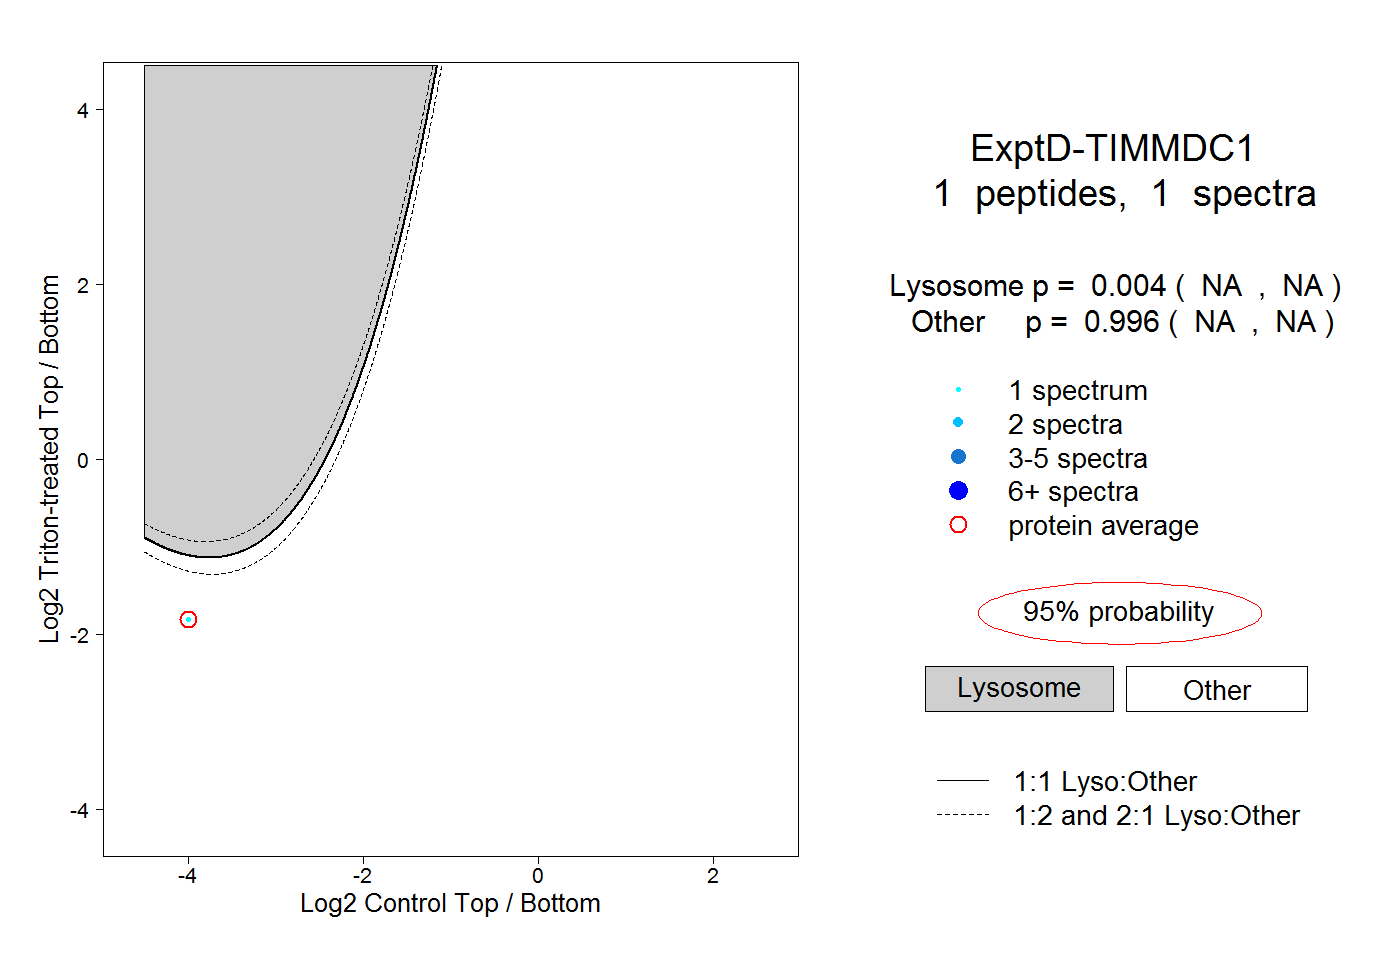 |
0.004 NA | NA |
0.996 NA | NA |