 1
1peptide
spectra
0.000 | 0.000
0.000 | 0.108
0.000 | 0.000
0.000 | 0.351
0.000 | 0.484
0.000 | 0.229
0.336 | 0.583
1peptide
spectrum
NA | NA
NA | NA
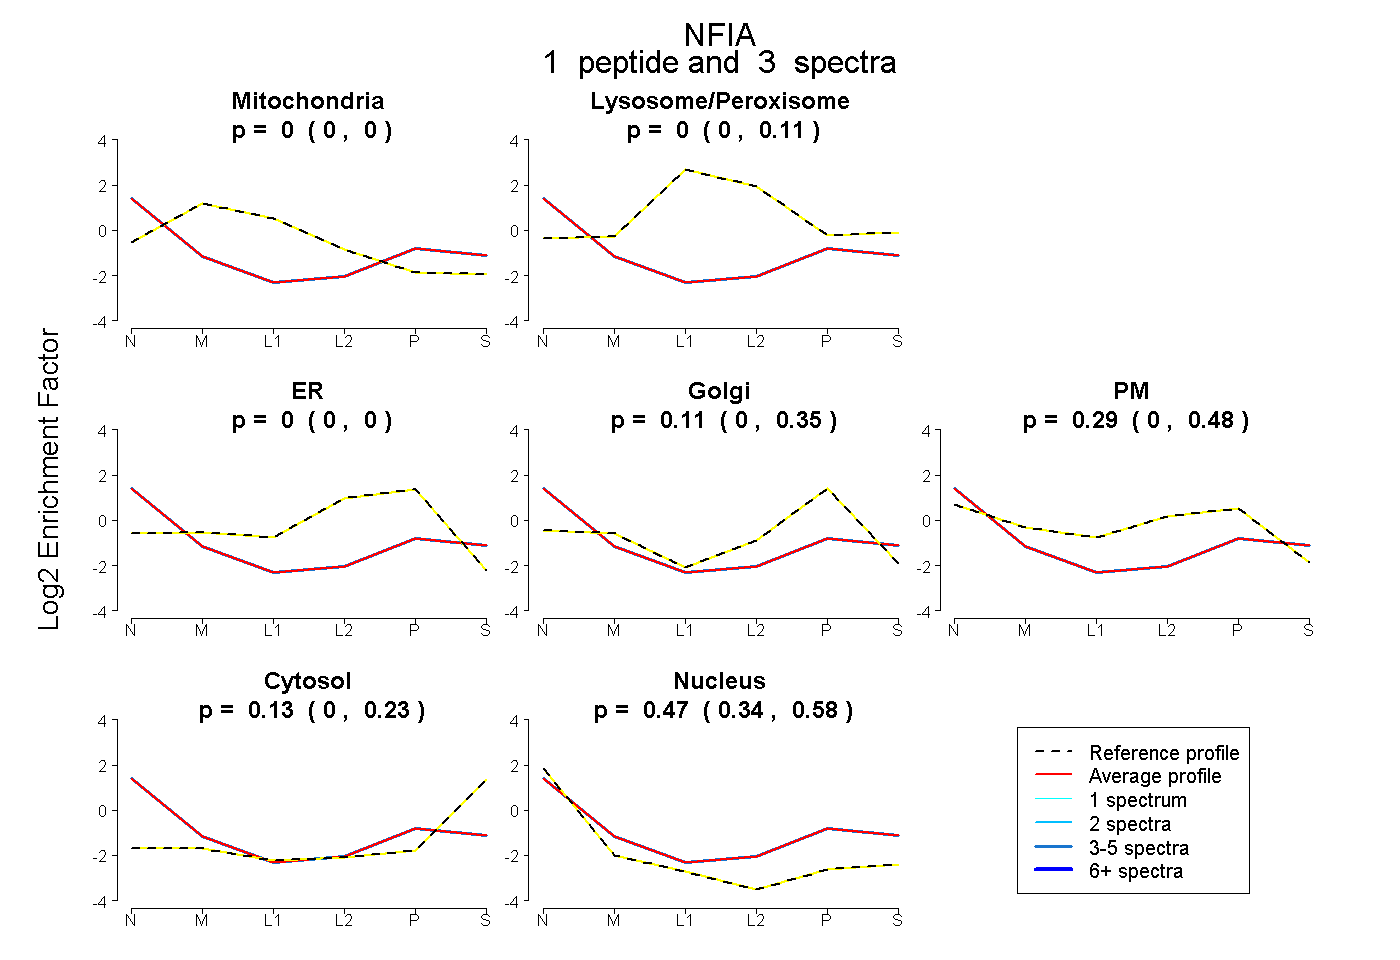
| Plot | Mito | Lyso or Perox | ER | Golgi | PM | Cytosol | Nucleus | ||||||
| Expt B |
1 peptide |
3 spectra |
|
0.000 0.000 | 0.000 |
0.000 0.000 | 0.108 |
0.000 0.000 | 0.000 |
0.108 0.000 | 0.351 |
0.290 0.000 | 0.484 |
0.134 0.000 | 0.229 |
0.468 0.336 | 0.583 |
|||
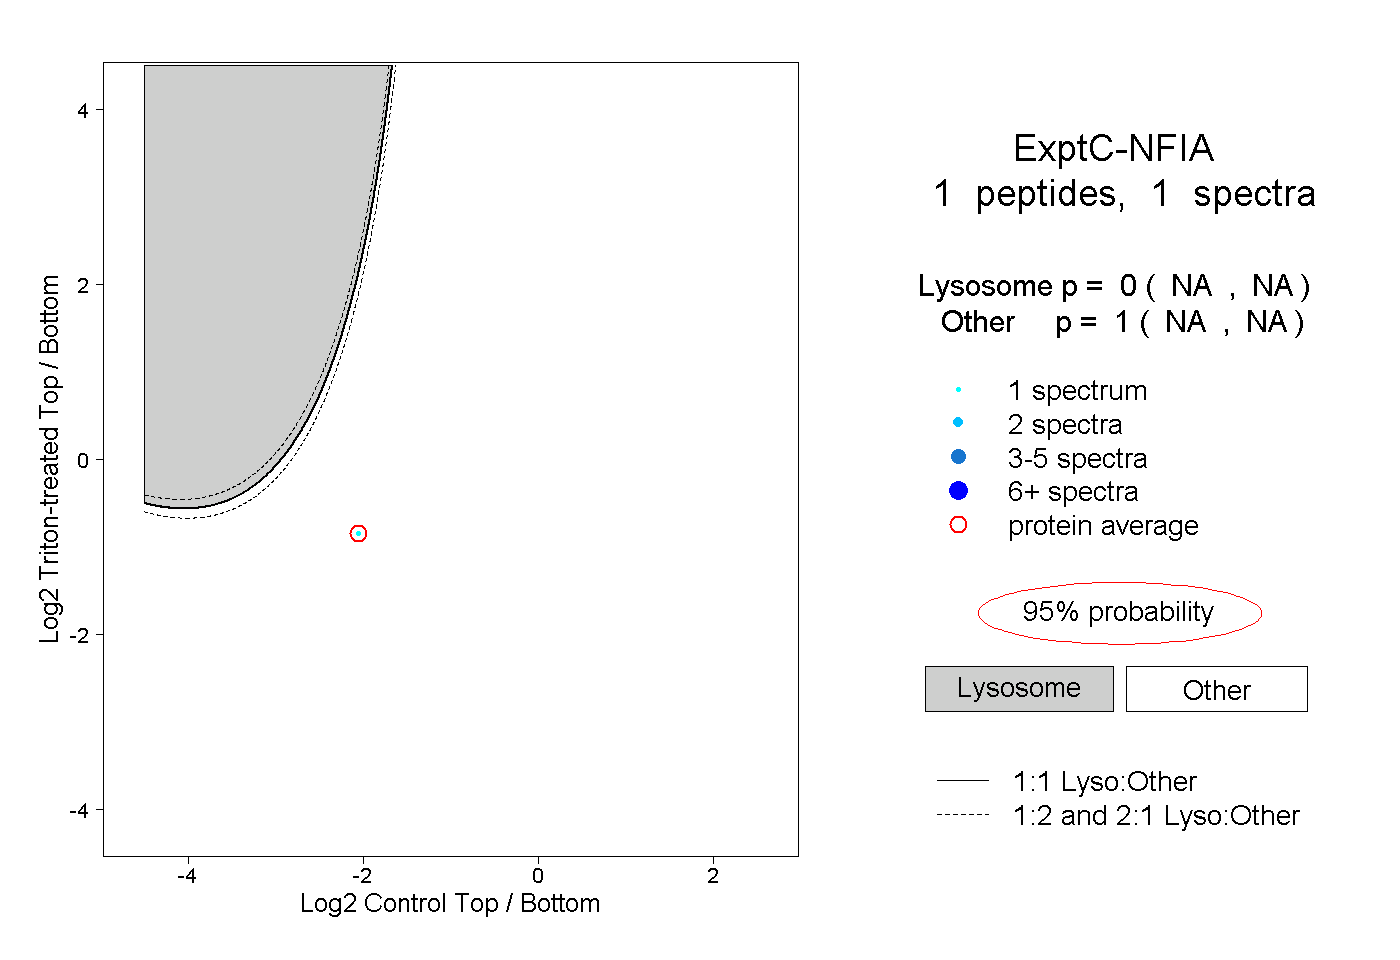
| Plot | Lyso | Other | |||||||||||
| Expt C |
1 peptide |
1 spectrum |
|
0.000 NA | NA |
1.000 NA | NA |