 4
4peptides
spectra
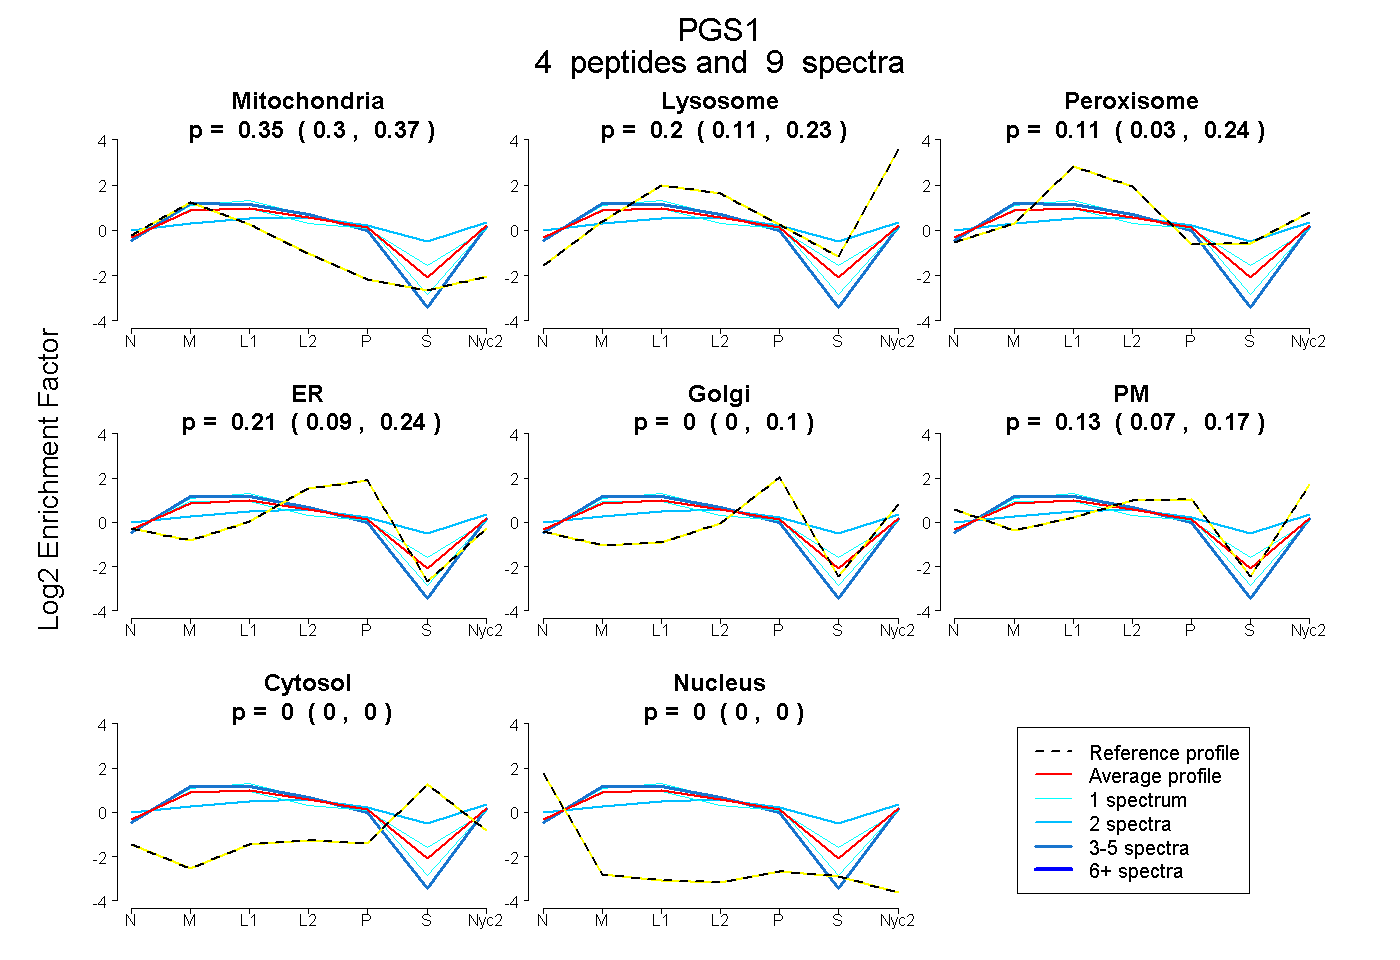
0.296 | 0.371
0.113 | 0.233
0.029 | 0.238
0.094 | 0.242
0.000 | 0.098
0.069 | 0.170
0.000 | 0.000
0.000 | 0.000
12peptides
spectra
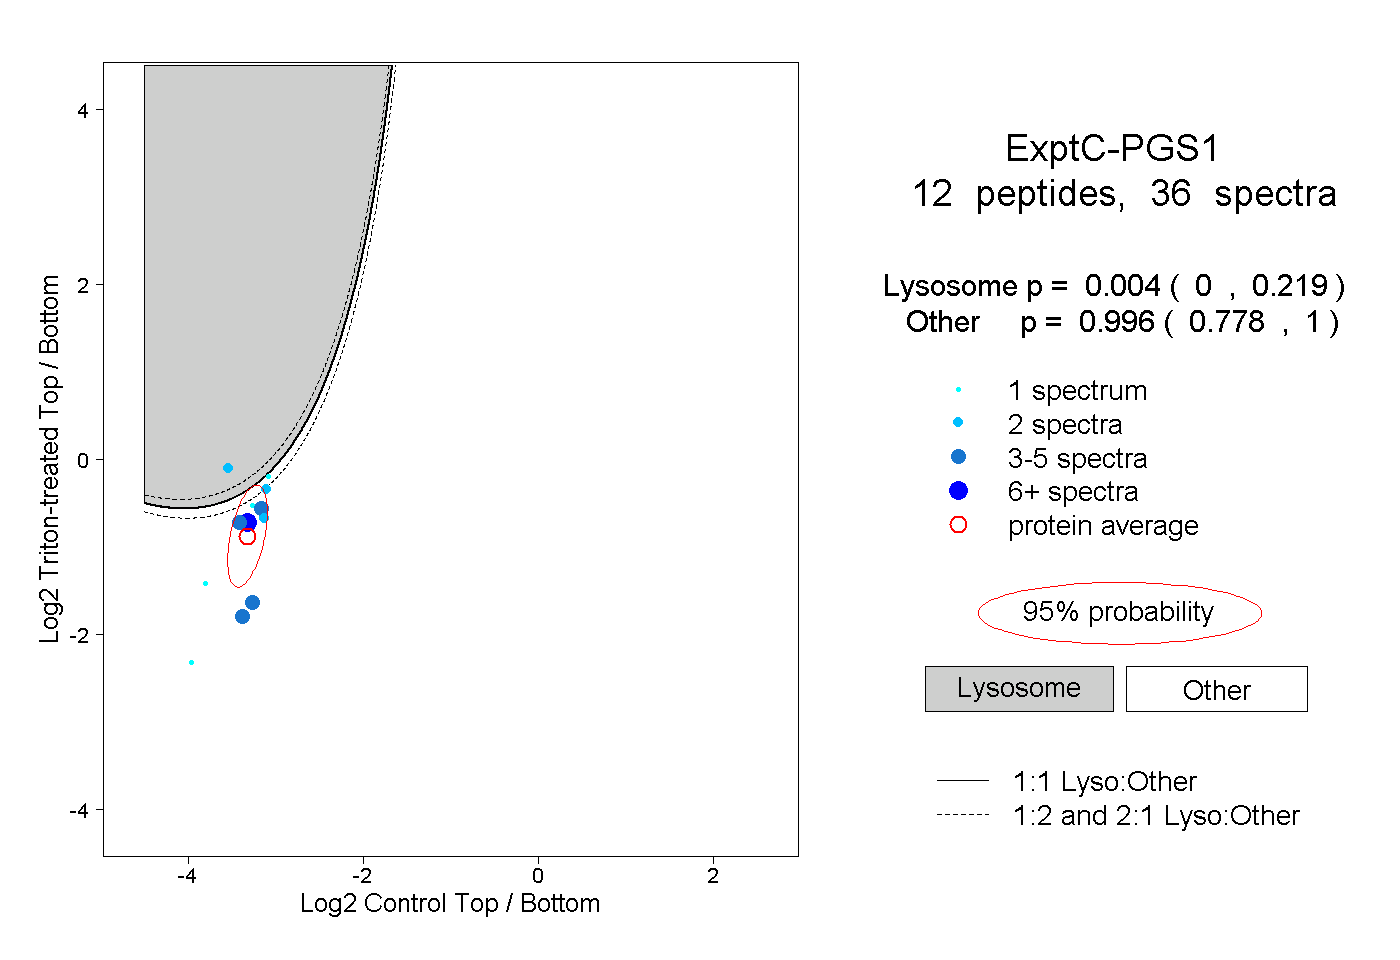
0.000 | 0.219
0.778 | 1.000
1peptide
spectrum
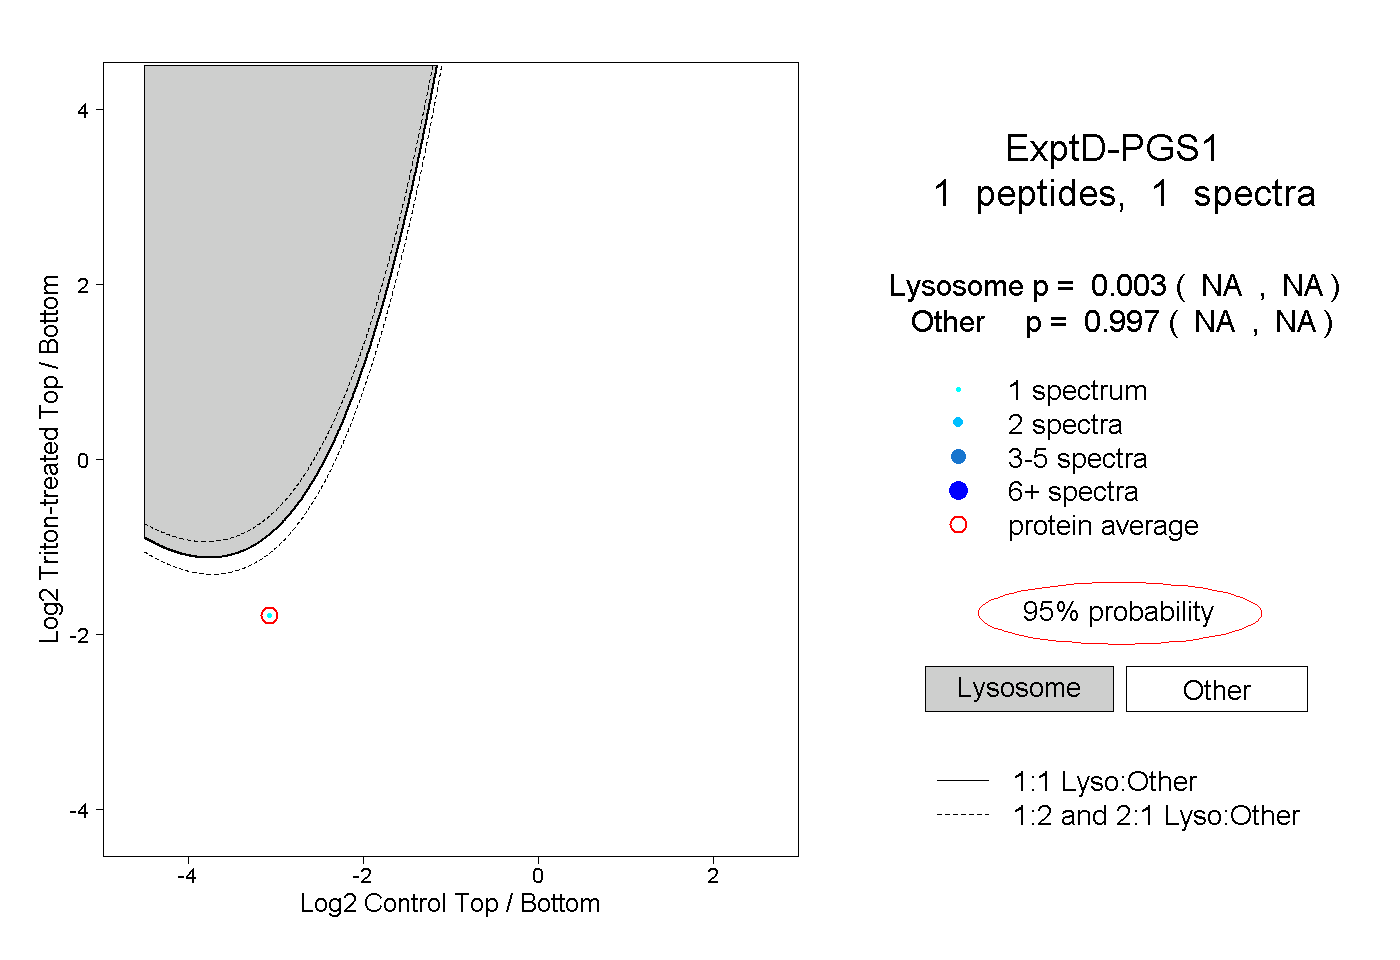
NA | NA
NA | NA