 3
3peptides
spectra
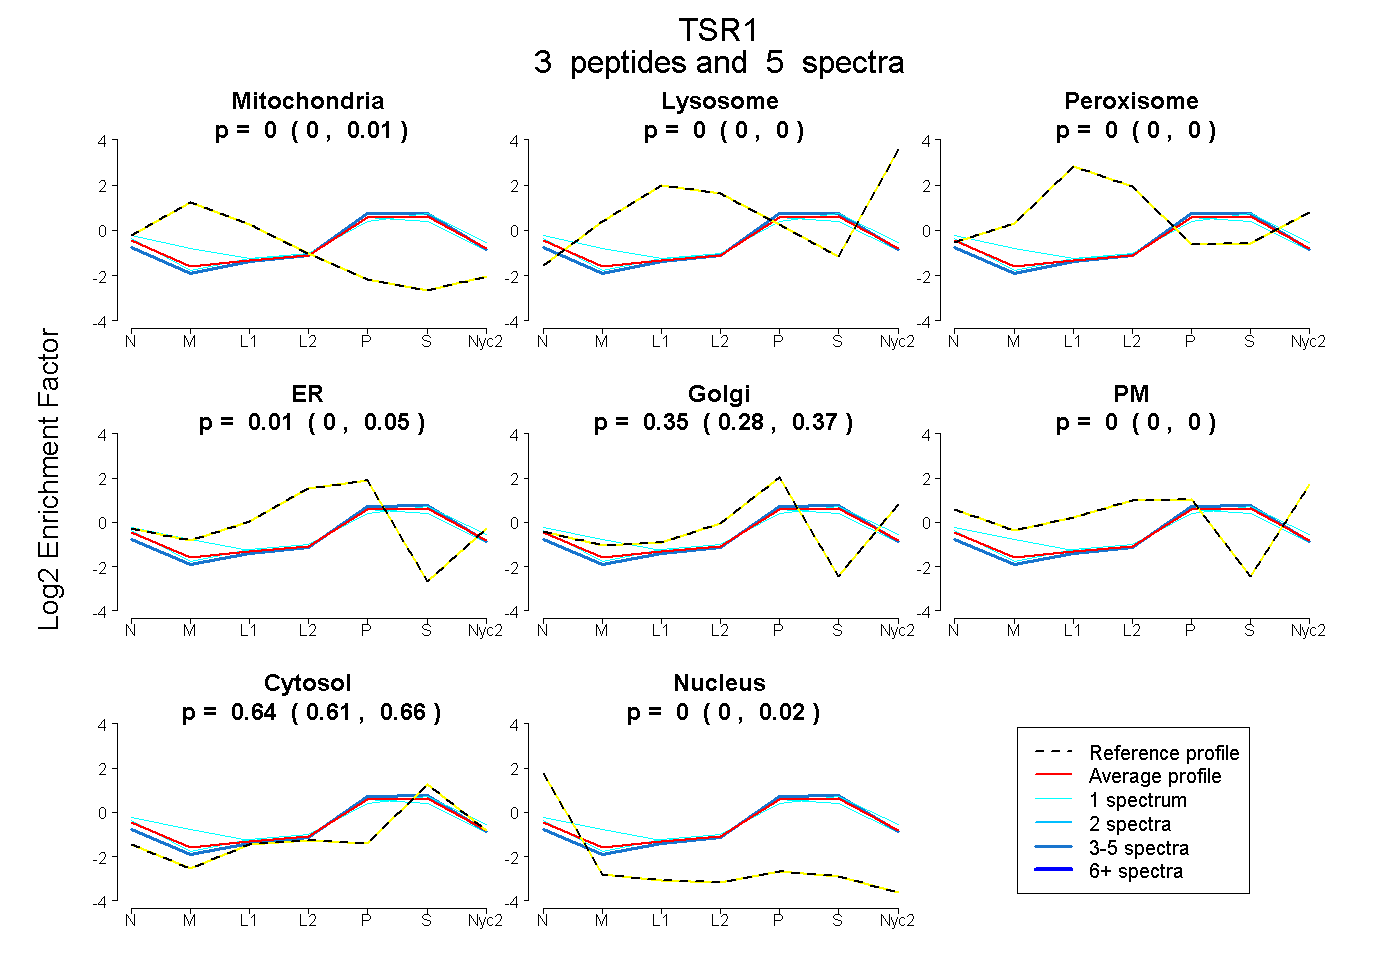
0.000 | 0.009
0.000 | 0.000
0.000 | 0.000
0.000 | 0.048
0.285 | 0.370
0.000 | 0.000
0.613 | 0.661
0.000 | 0.020
| Plot | Mito | Lyso | Perox | ER | Golgi | PM | Cytosol | Nucleus | |||||
| Expt A |
3 peptides |
5 spectra |
|
0.000 0.000 | 0.009 |
0.000 0.000 | 0.000 |
0.000 0.000 | 0.000 |
0.005 0.000 | 0.048 |
0.348 0.285 | 0.370 |
0.000 0.000 | 0.000 |
0.642 0.613 | 0.661 |
0.004 0.000 | 0.020 |
| 1 spectrum, YMFFSR | 0.000 | 0.000 | 0.000 | 0.000 | 0.338 | 0.000 | 0.662 | 0.000 | ||
| 1 spectrum, IFQFQNFVNTR | 0.106 | 0.000 | 0.000 | 0.000 | 0.364 | 0.000 | 0.530 | 0.000 | ||
| 3 spectra, MSVLNMVVSR | 0.000 | 0.000 | 0.000 | 0.000 | 0.331 | 0.000 | 0.669 | 0.000 |
| Plot | Lyso | Other | |||||||||||
| Expt C |
1 peptide |
1 spectrum |
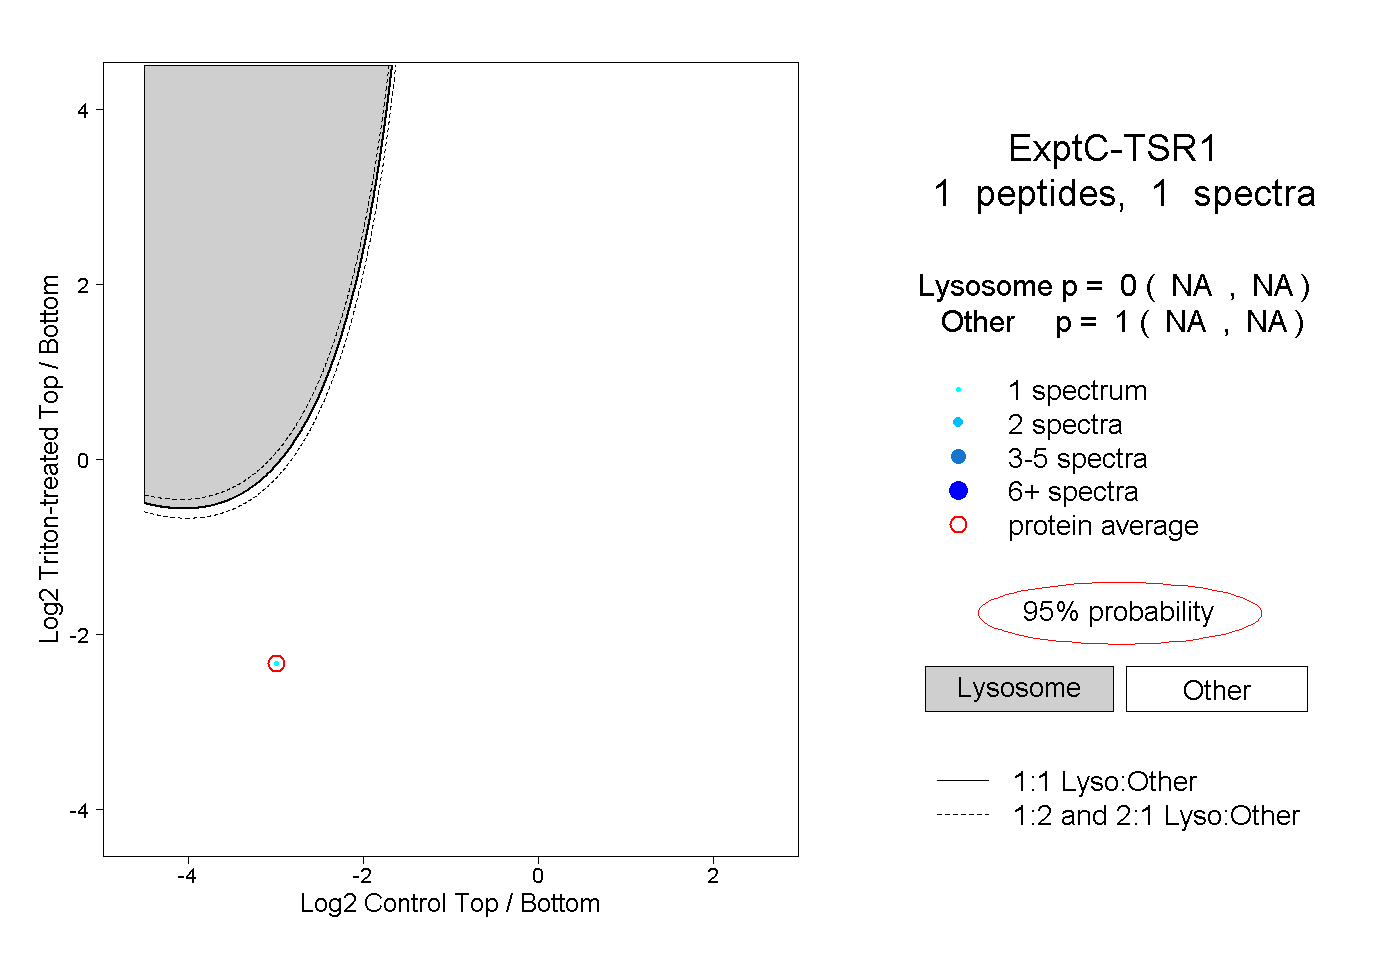 |
0.000 NA | NA |
1.000 NA | NA |