 2
2peptides
spectra
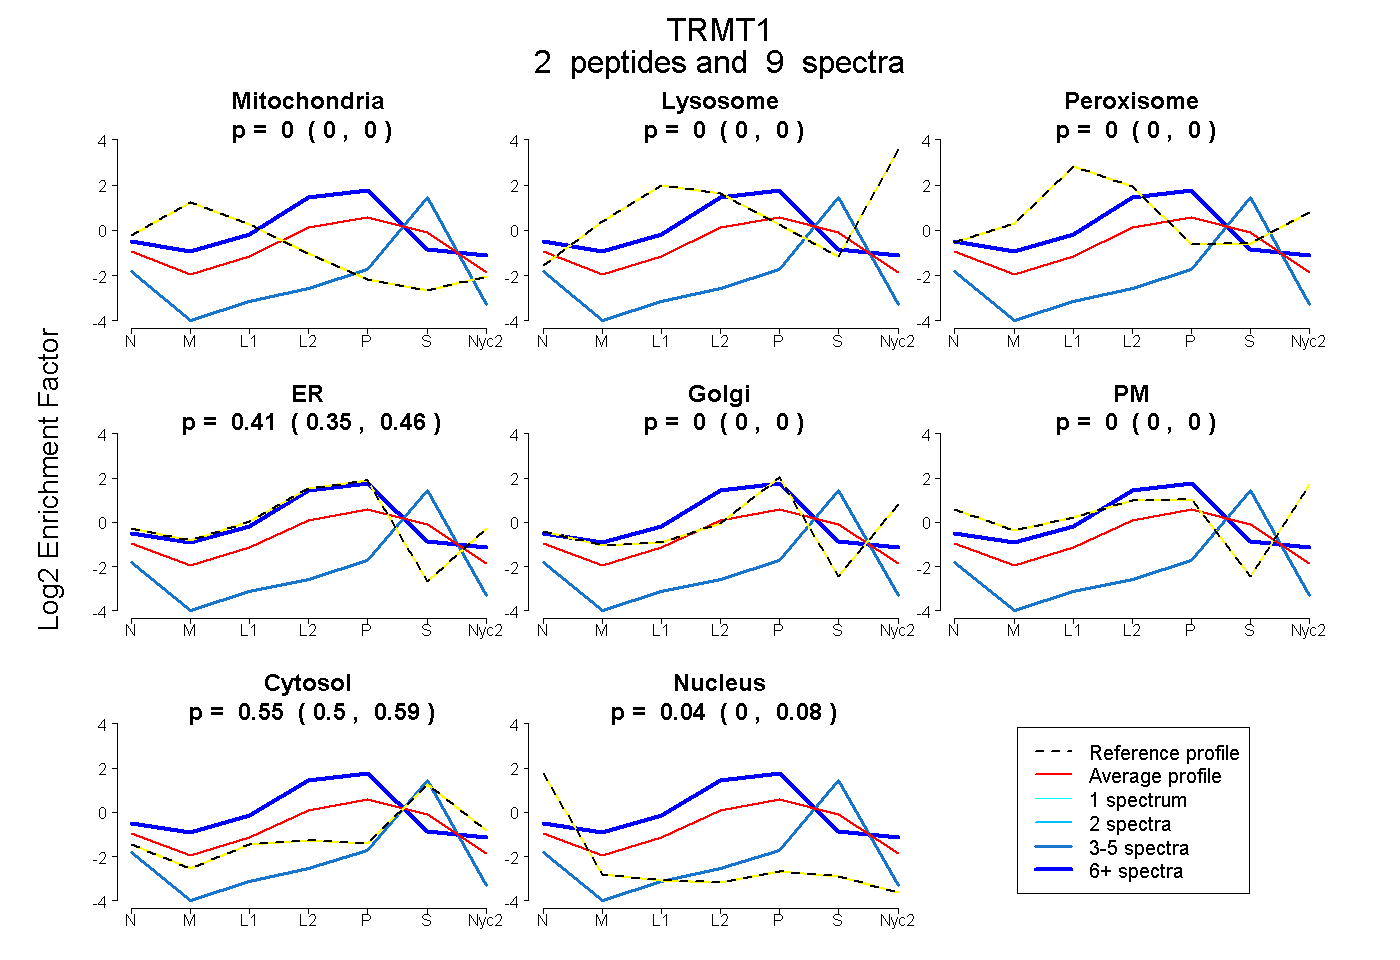
0.000 | 0.000
0.000 | 0.000
0.000 | 0.000
0.352 | 0.456
0.000 | 0.000
0.000 | 0.000
0.497 | 0.593
0.000 | 0.081
2peptides
spectra
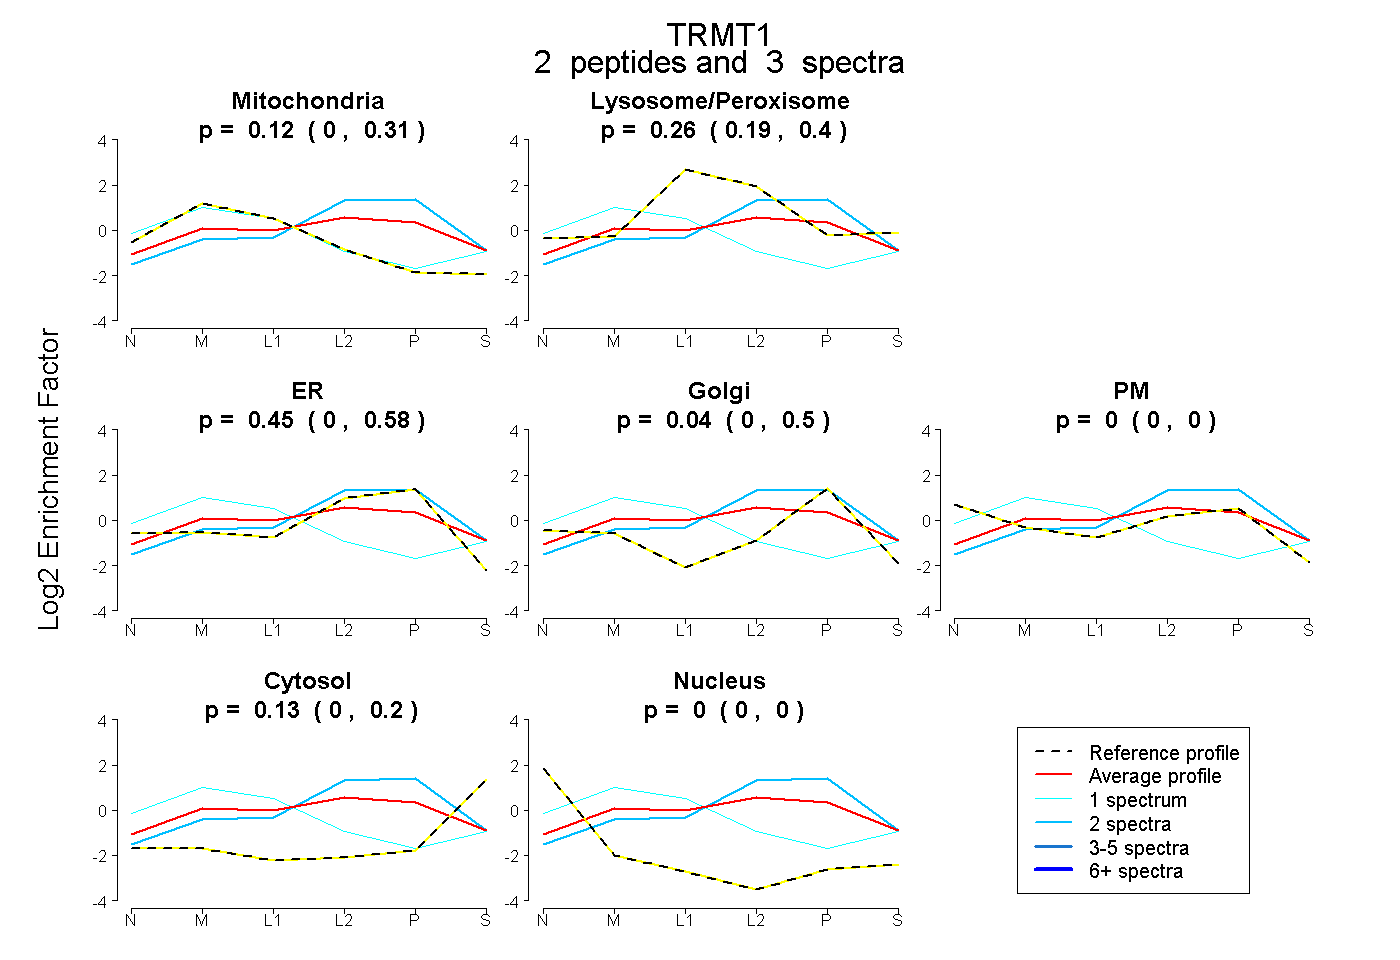
0.000 | 0.309
0.186 | 0.402
0.000 | 0.584
0.000 | 0.503
0.000 | 0.000
0.000 | 0.202
0.000 | 0.000
1peptide
spectra
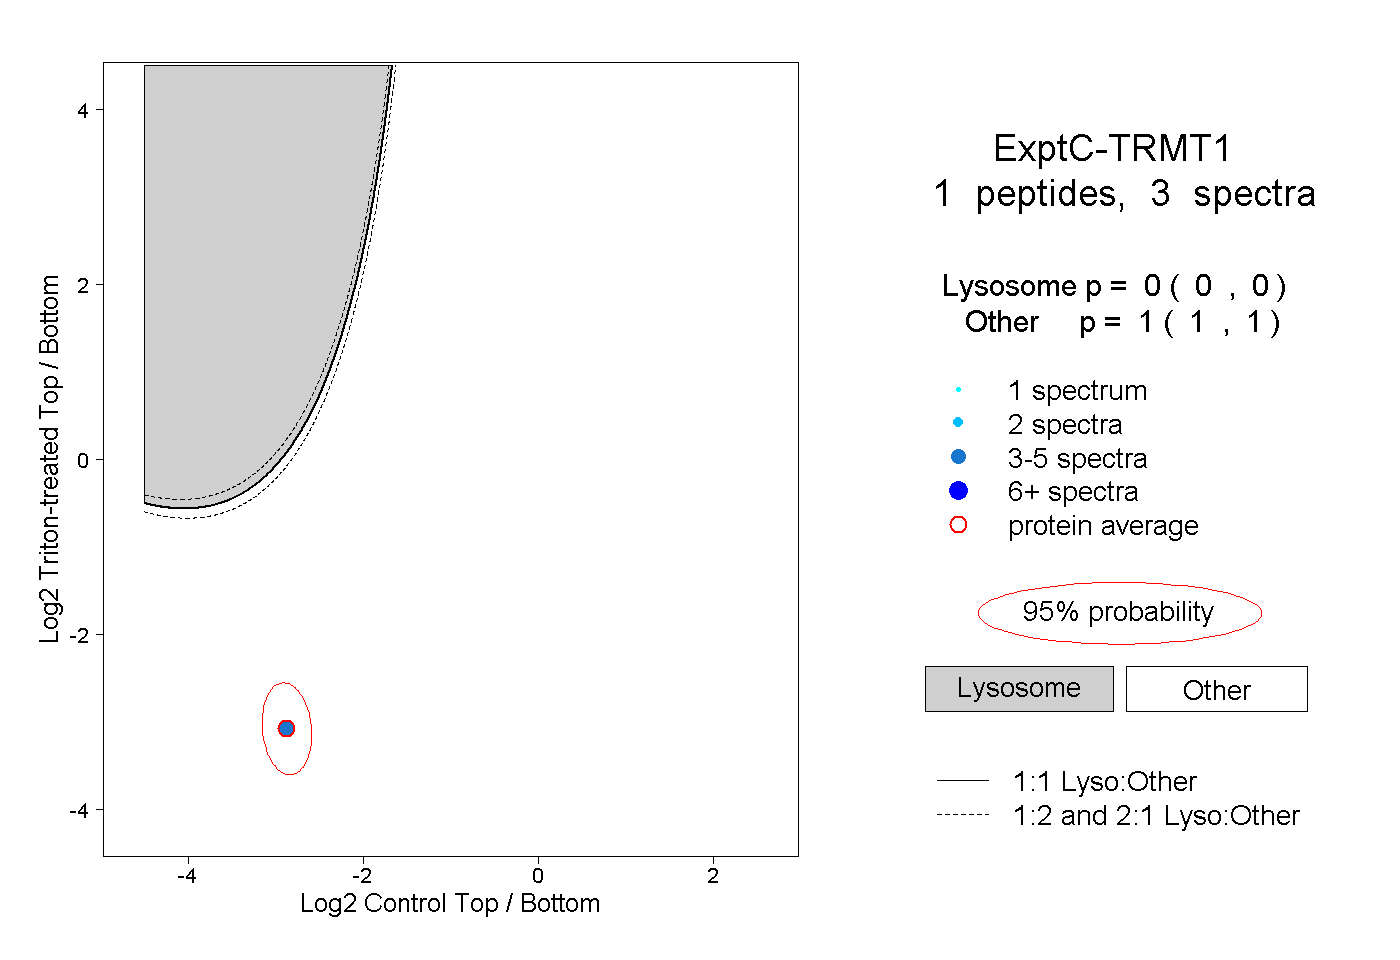
0.000 | 0.000
1.000 | 1.000