 3
3peptides
spectra
0.000 | 0.006
0.000 | 0.000
0.000 | 0.066
0.000 | 0.507
0.000 | 0.411
0.000 | 0.308
0.000 | 0.195
0.312 | 0.497
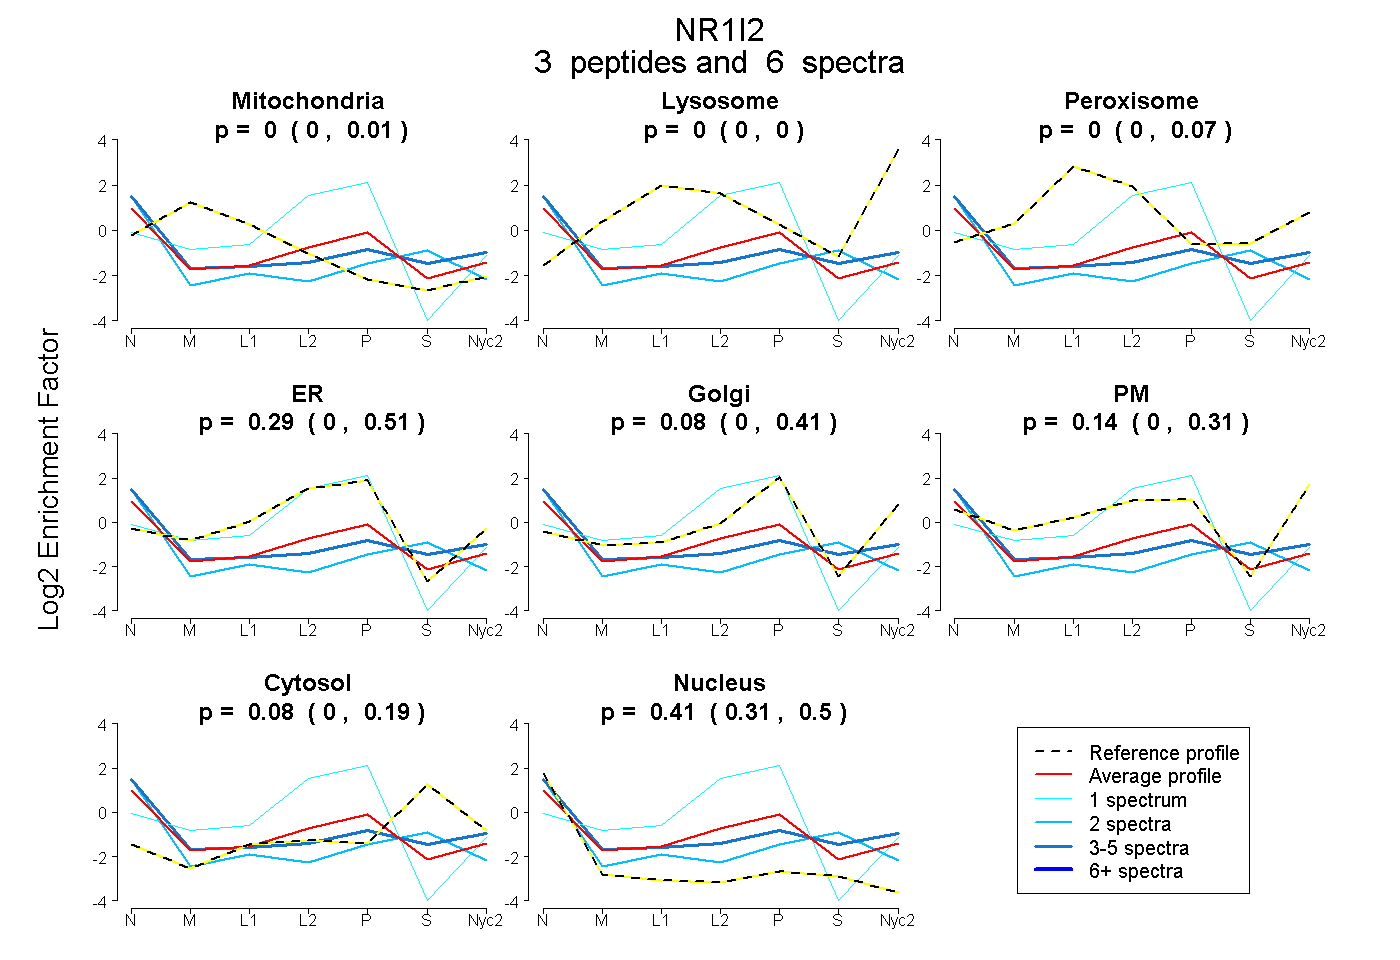
| Plot | Mito | Lyso | Perox | ER | Golgi | PM | Cytosol | Nucleus | |||||
| Expt A |
3 peptides |
6 spectra |
|
0.000 0.000 | 0.006 |
0.000 0.000 | 0.000 |
0.000 0.000 | 0.066 |
0.293 0.000 | 0.507 |
0.081 0.000 | 0.411 |
0.138 0.000 | 0.308 |
0.077 0.000 | 0.195 |
0.411 0.312 | 0.497 |
| 1 spectrum, WNHVGLVQR | 0.000 | 0.000 | 0.000 | 0.932 | 0.000 | 0.000 | 0.000 | 0.068 | ||
| 2 spectra, IMAVLTELR | 0.000 | 0.000 | 0.014 | 0.000 | 0.000 | 0.109 | 0.311 | 0.566 | ||
| 3 spectra, VISHFR | 0.000 | 0.000 | 0.000 | 0.000 | 0.000 | 0.386 | 0.174 | 0.440 |