 1
1peptide
spectra
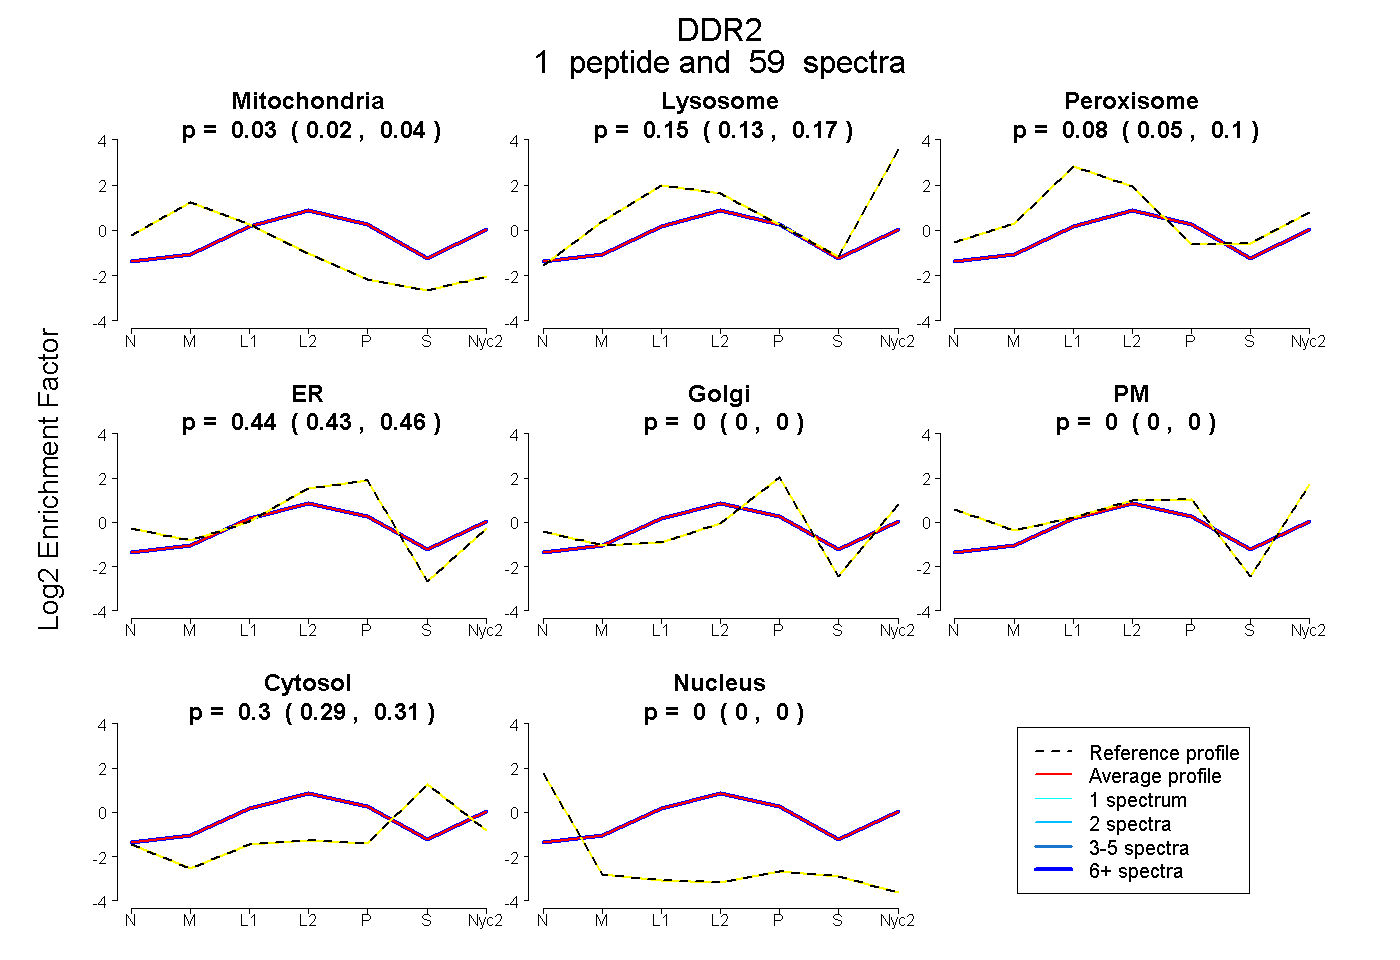
0.016 | 0.041
0.131 | 0.171
0.049 | 0.101
0.430 | 0.459
0.000 | 0.000
0.000 | 0.000
0.286 | 0.306
0.000 | 0.000
2peptides
spectra
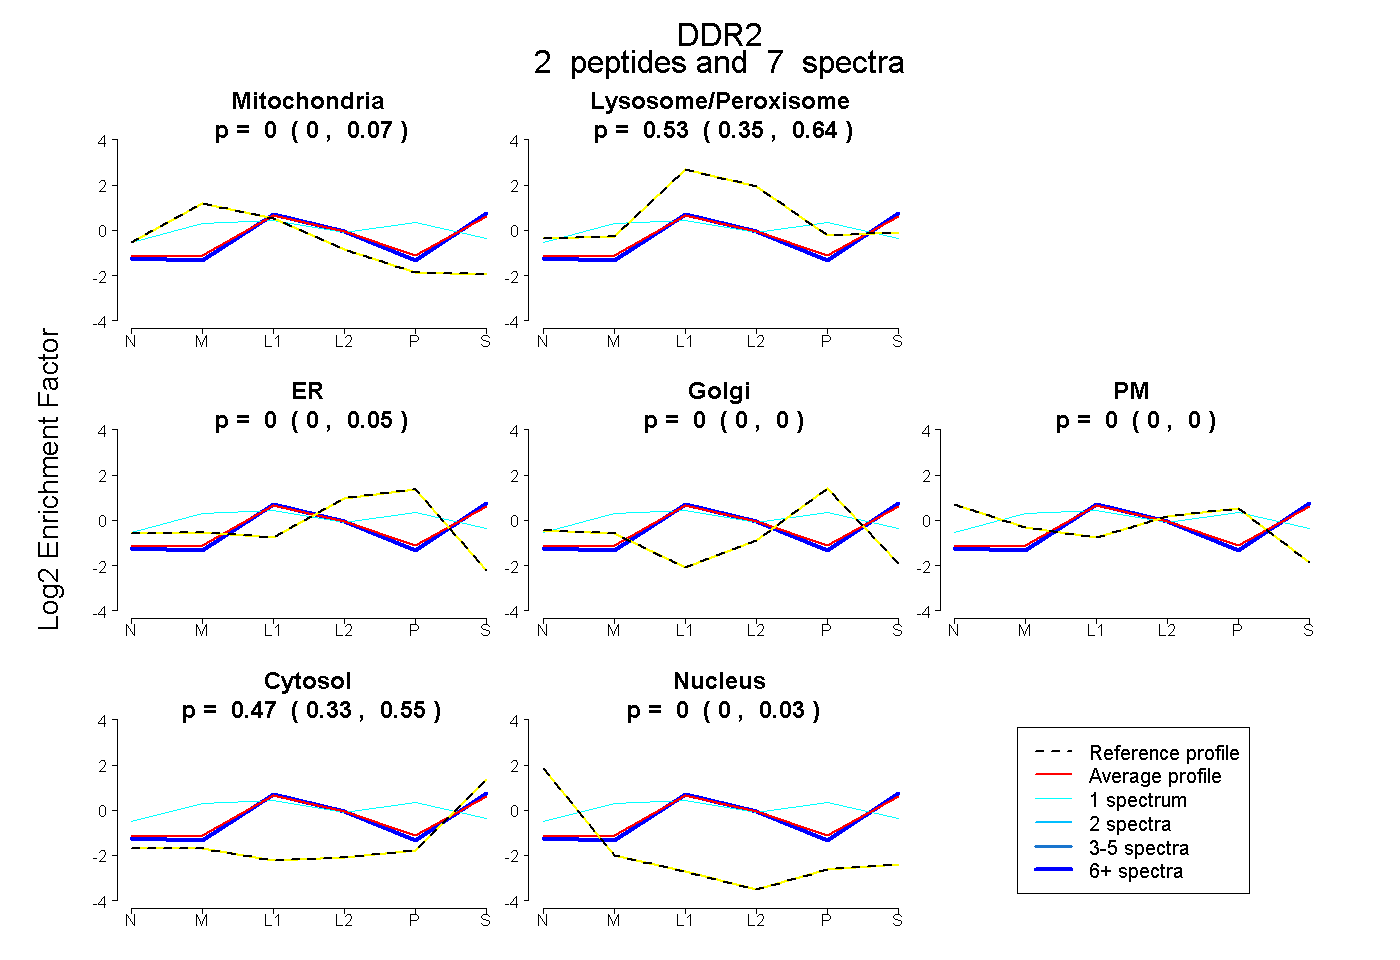
0.000 | 0.067
0.347 | 0.643
0.000 | 0.048
0.000 | 0.000
0.000 | 0.000
0.330 | 0.548
0.000 | 0.034
1peptide
spectra
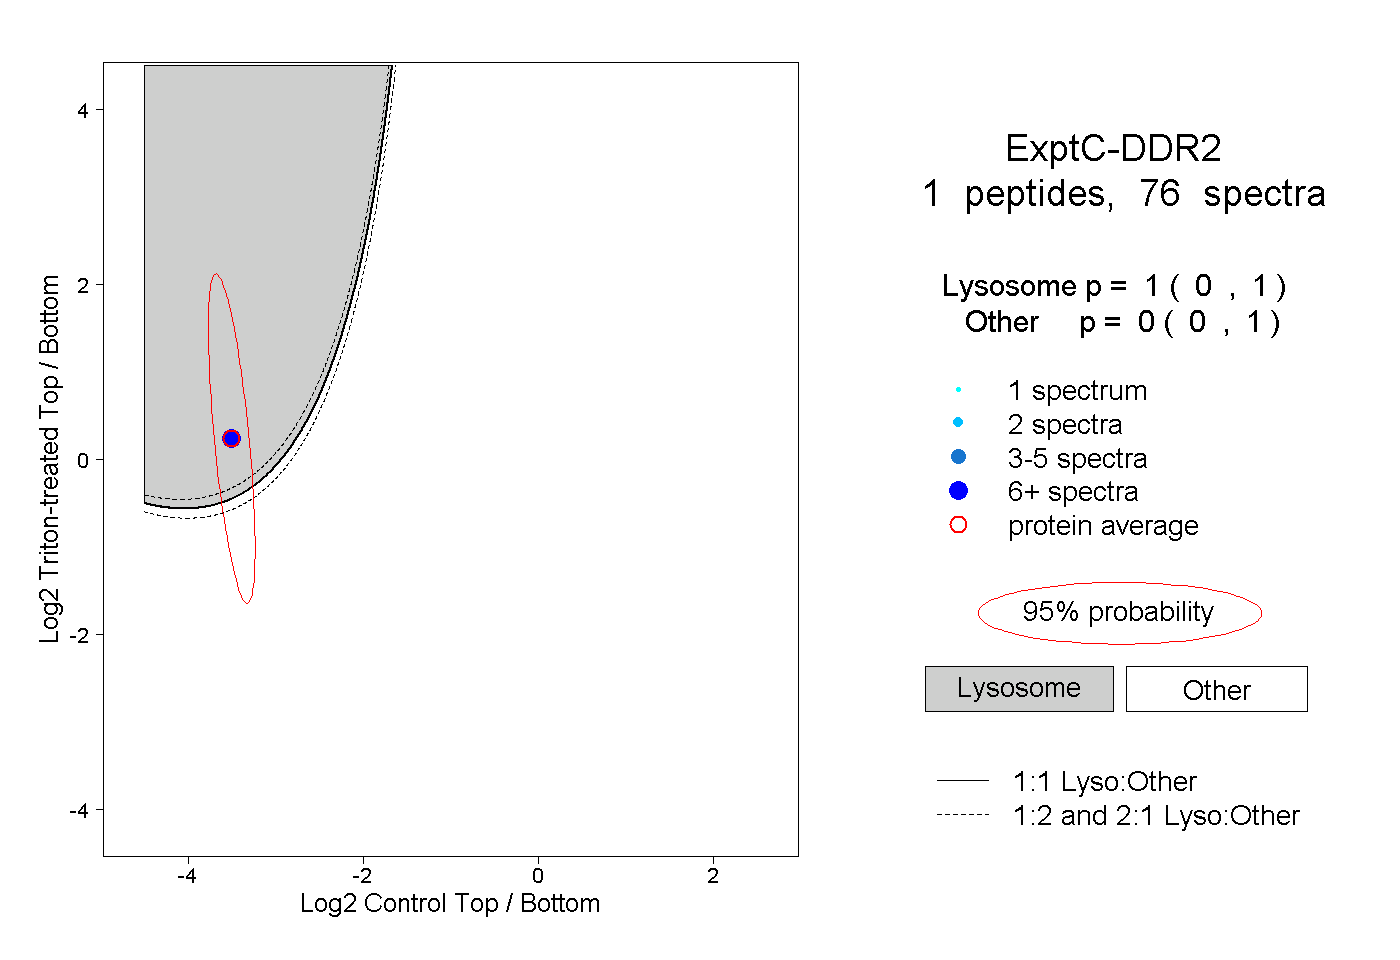
0.000 | 1.000
0.000 | 1.000
2peptides
spectra
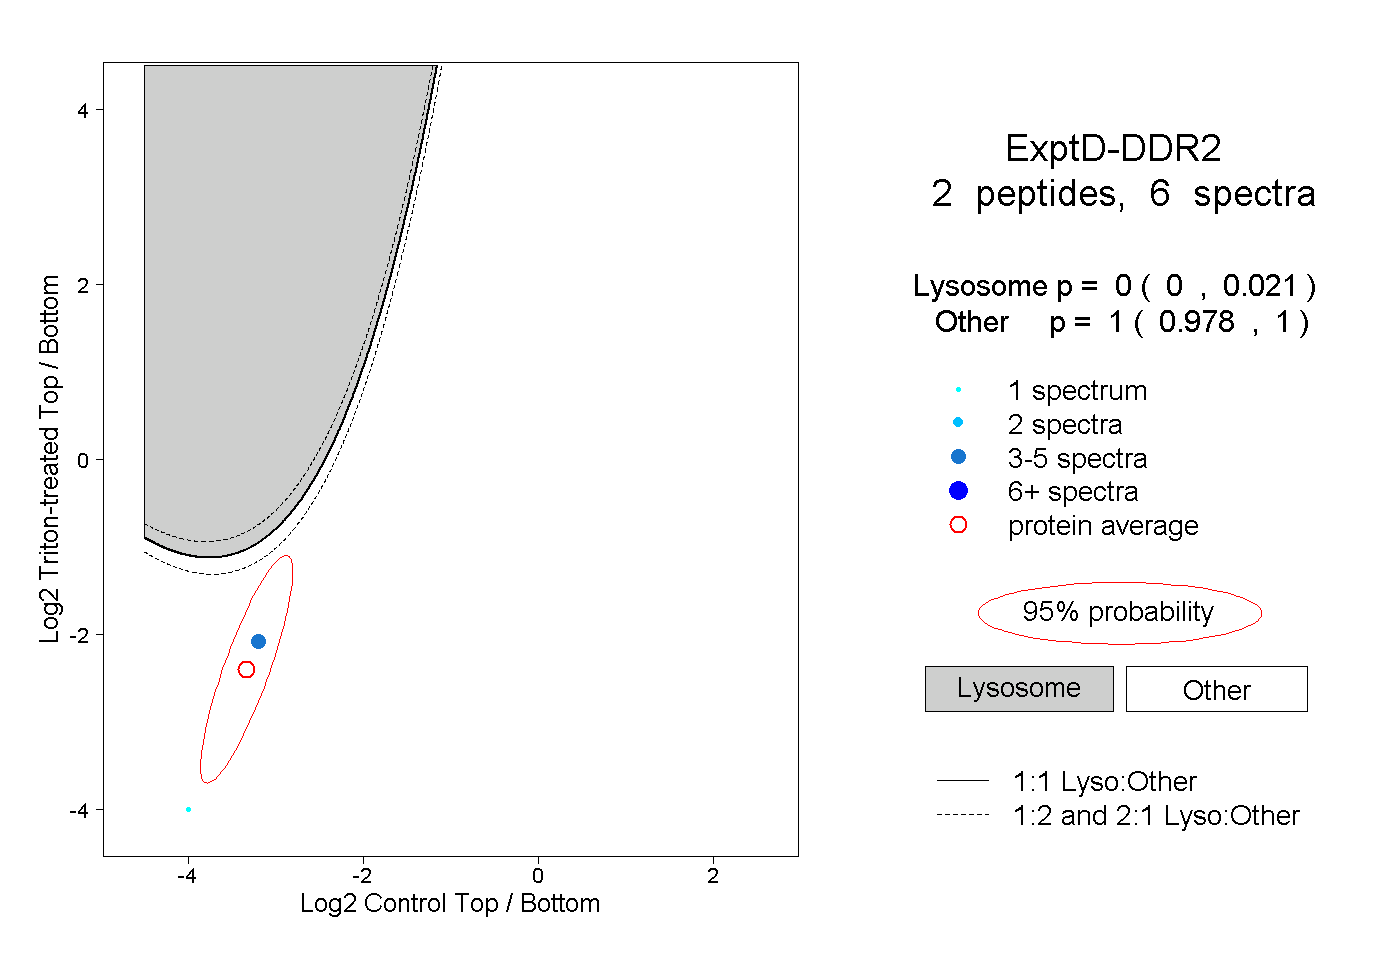
0.000 | 0.021
0.978 | 1.000