 4
4peptides
spectra
0.000 | 0.000
0.457 | 0.566
0.000 | 0.000
0.000 | 0.000
0.194 | 0.383
0.000 | 0.142
0.079 | 0.177
0.000 | 0.000
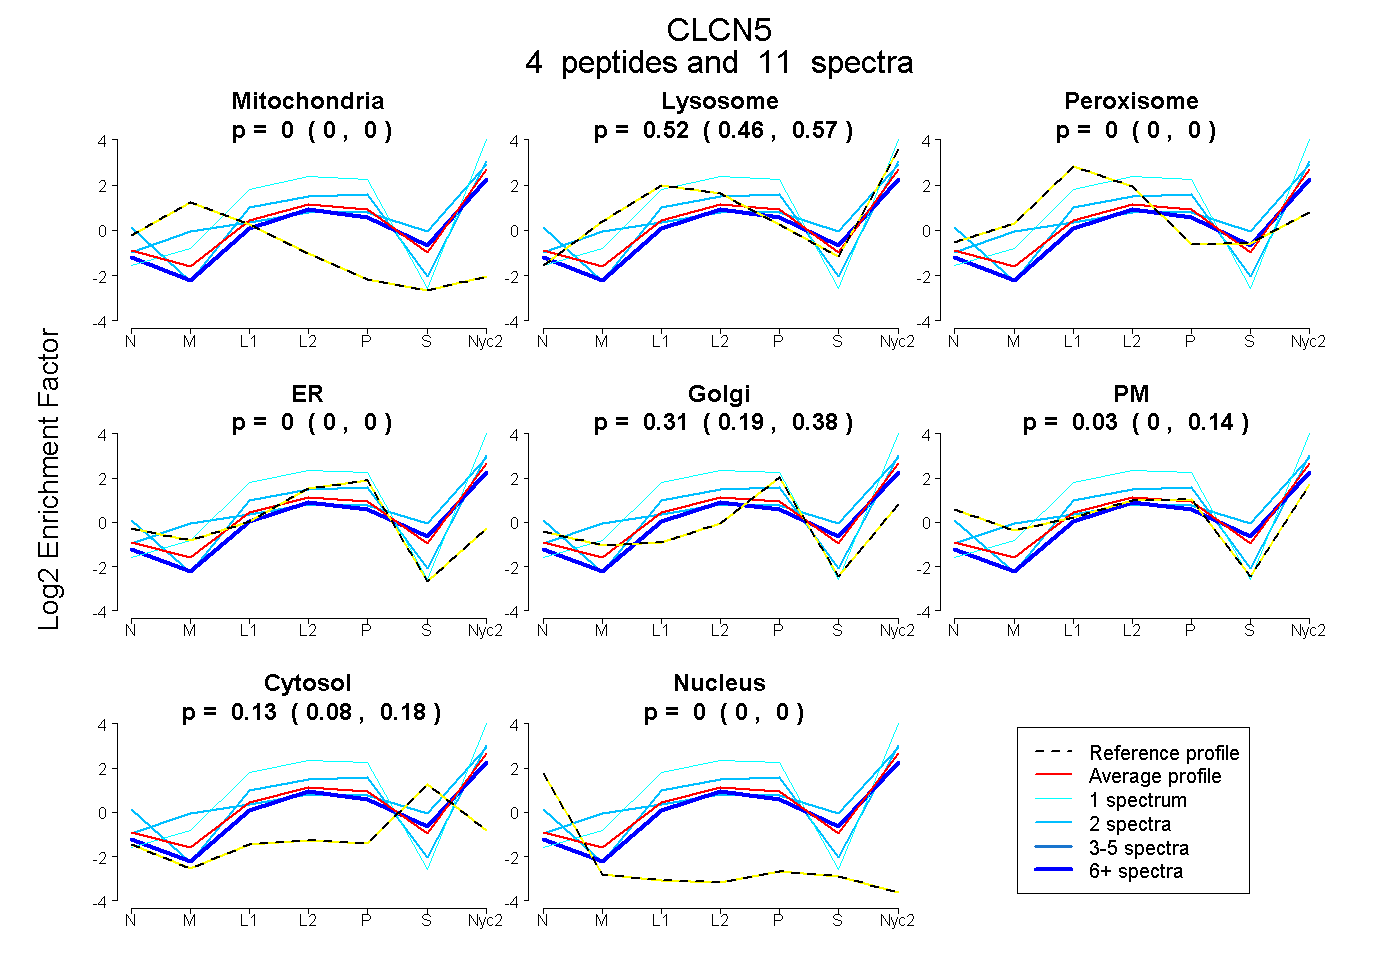
| Plot | Mito | Lyso | Perox | ER | Golgi | PM | Cytosol | Nucleus | |||||
| Expt A |
4 peptides |
11 spectra |
|
0.000 0.000 | 0.000 |
0.525 0.457 | 0.566 |
0.000 0.000 | 0.000 |
0.000 0.000 | 0.000 |
0.314 0.194 | 0.383 |
0.027 0.000 | 0.142 |
0.134 0.079 | 0.177 |
0.000 0.000 | 0.000 |
| 6 spectra, LVGFVIR | 0.000 | 0.446 | 0.000 | 0.000 | 0.271 | 0.000 | 0.283 | 0.000 | ||
| 2 spectra, EGIYDAHIR | 0.000 | 0.296 | 0.000 | 0.000 | 0.119 | 0.585 | 0.000 | 0.000 | ||
| 2 spectra, DLIISIENAR | 0.000 | 0.670 | 0.000 | 0.000 | 0.152 | 0.000 | 0.179 | 0.000 | ||
| 1 spectrum, WVADALGR | 0.000 | 0.791 | 0.000 | 0.180 | 0.029 | 0.000 | 0.000 | 0.000 |
| Plot | Lyso | Other | |||||||||||
| Expt C |
4 peptides |
25 spectra |
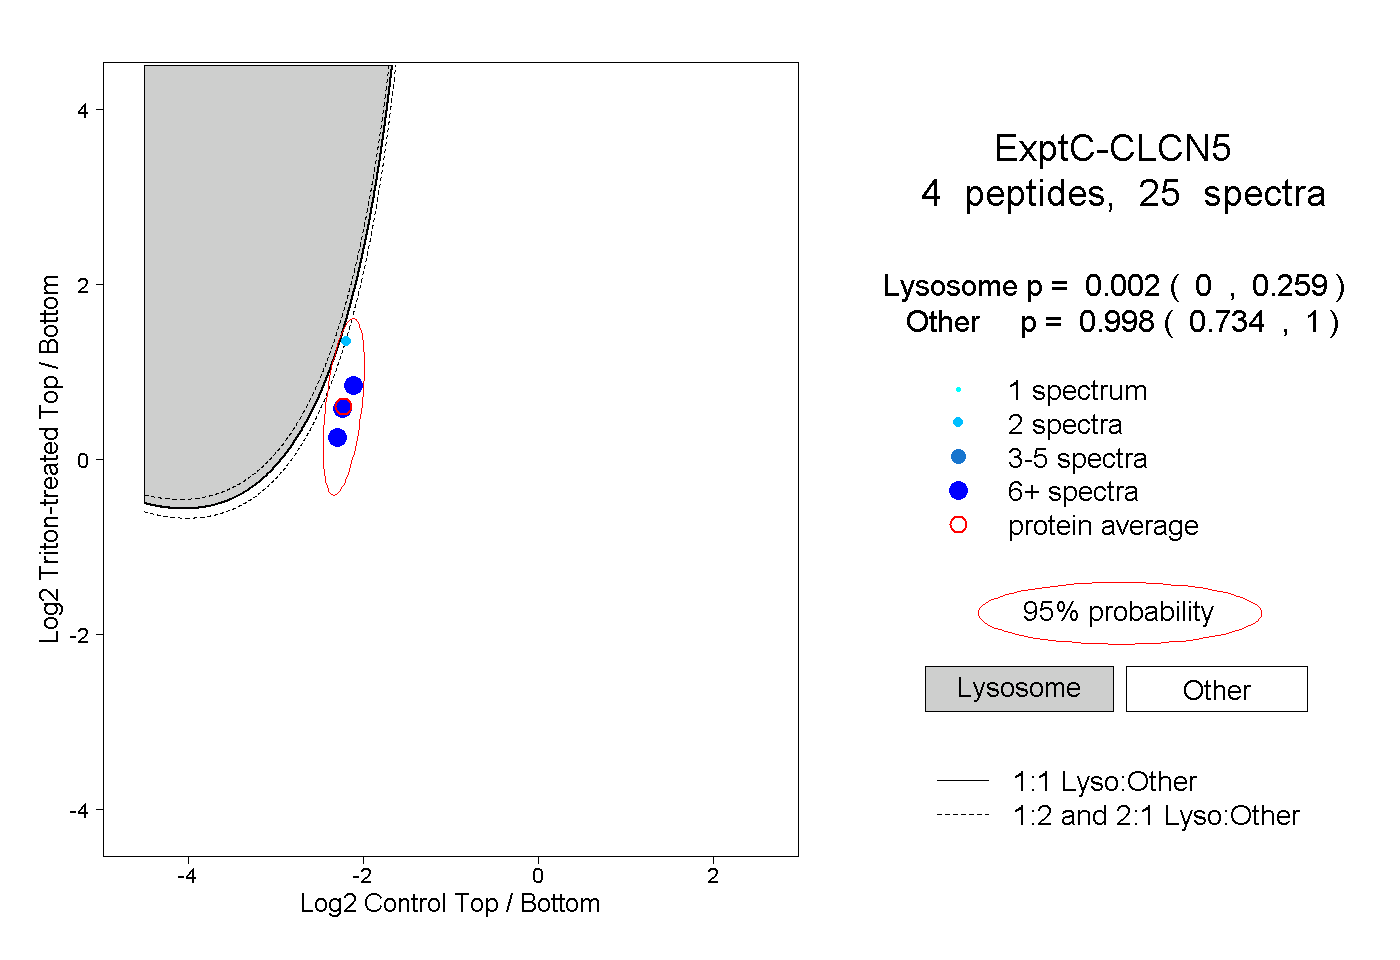 |
0.002 0.000 | 0.259 |
0.998 0.734 | 1.000 |
||||||||
| Plot | Lyso | Other | |||||||||||
| Expt D |
3 peptides |
5 spectra |
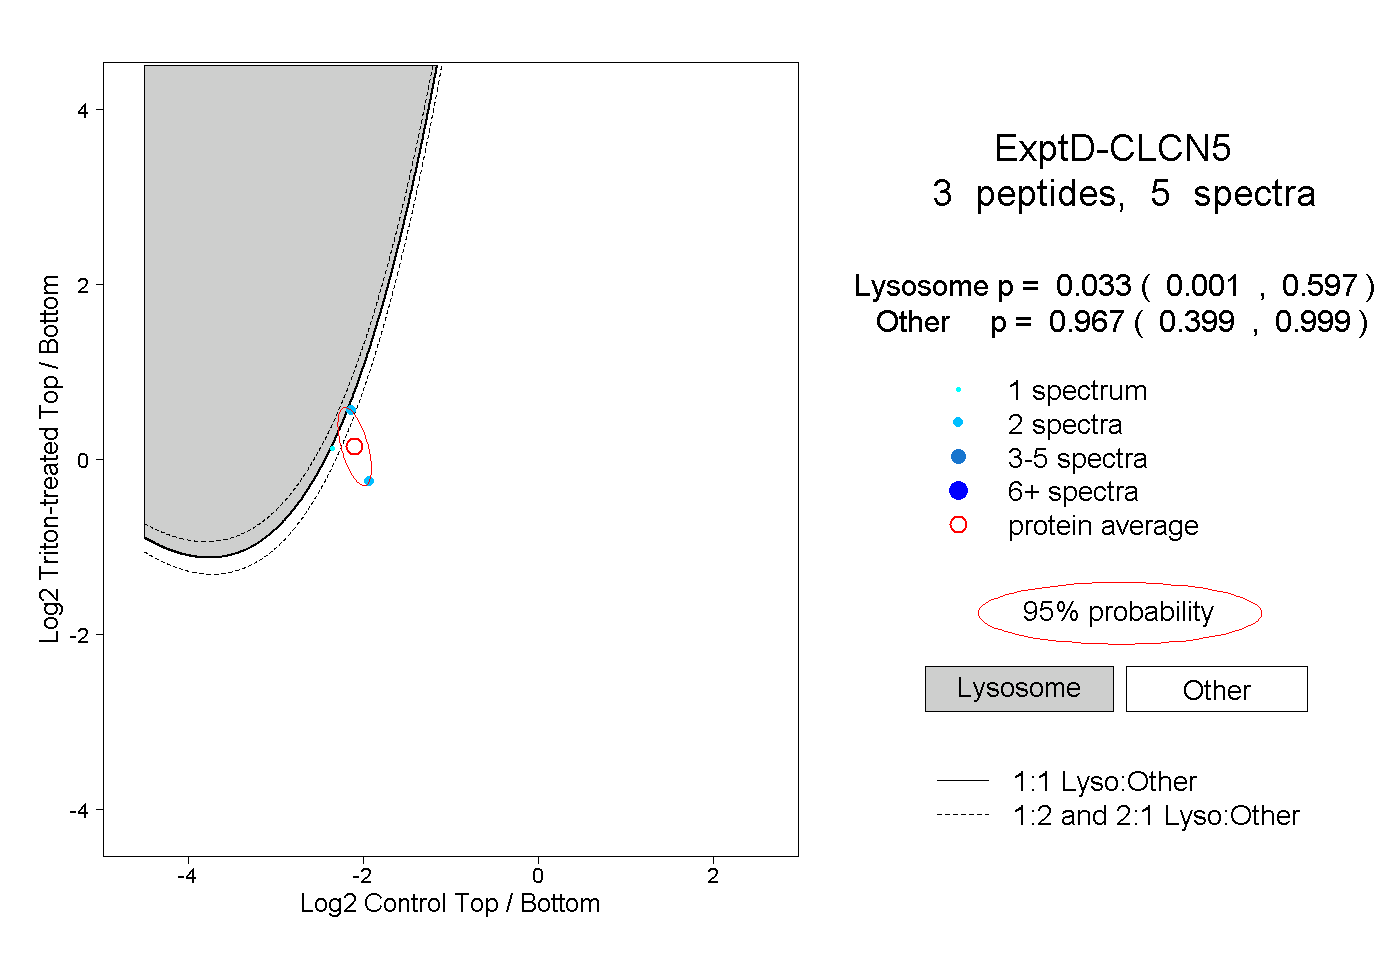 |
0.033 0.001 | 0.597 |
0.967 0.399 | 0.999 |