15
15peptides
spectra
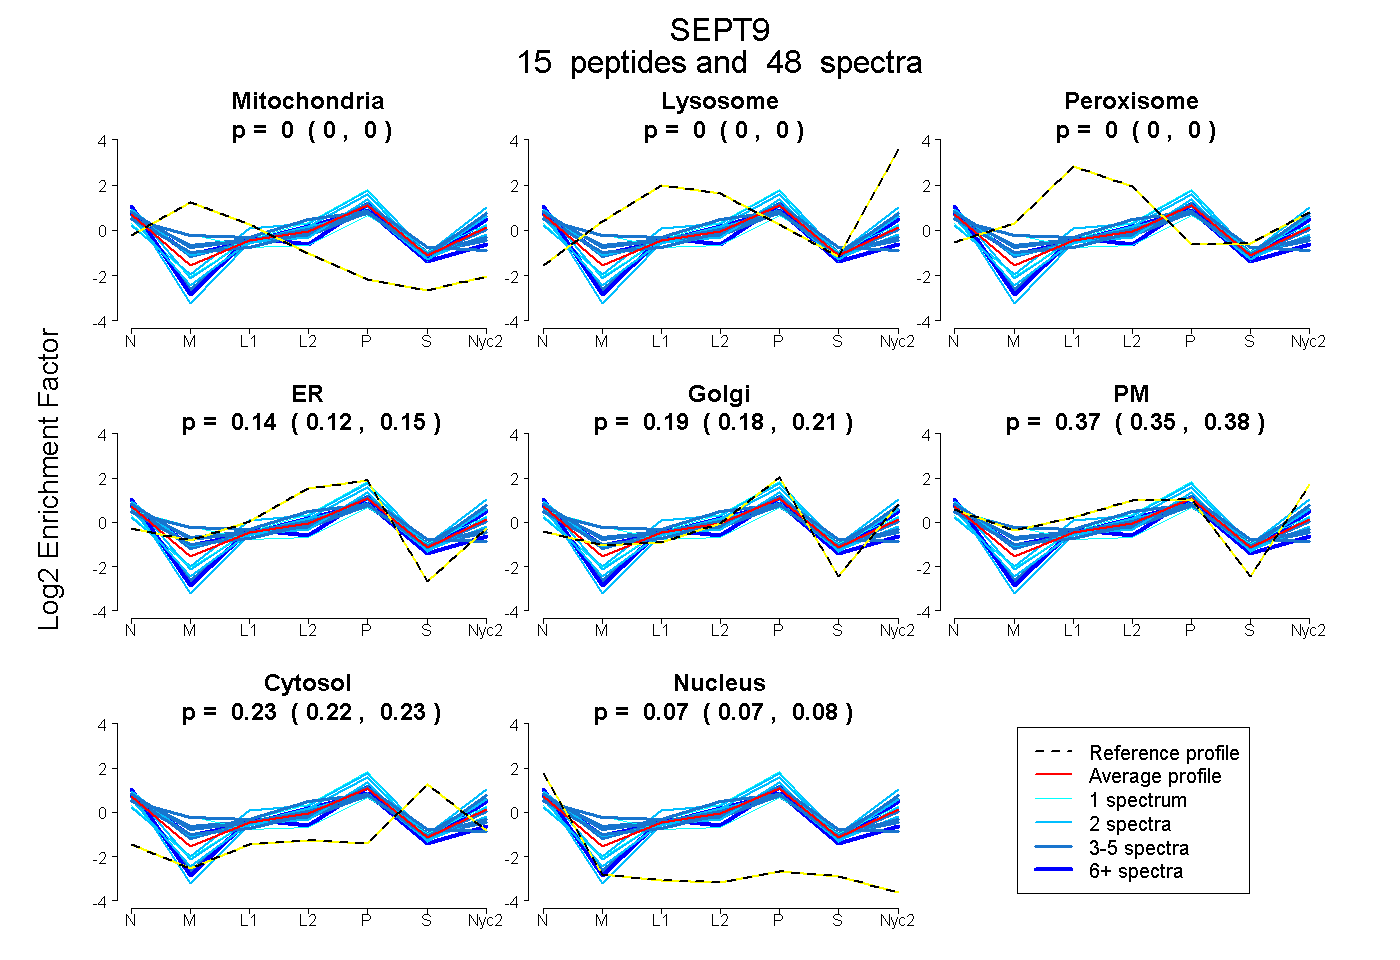
0.000 | 0.000
0.000 | 0.000
0.000 | 0.000
0.119 | 0.153
0.178 | 0.206
0.353 | 0.382
0.221 | 0.229
0.071 | 0.078
6peptides
spectra
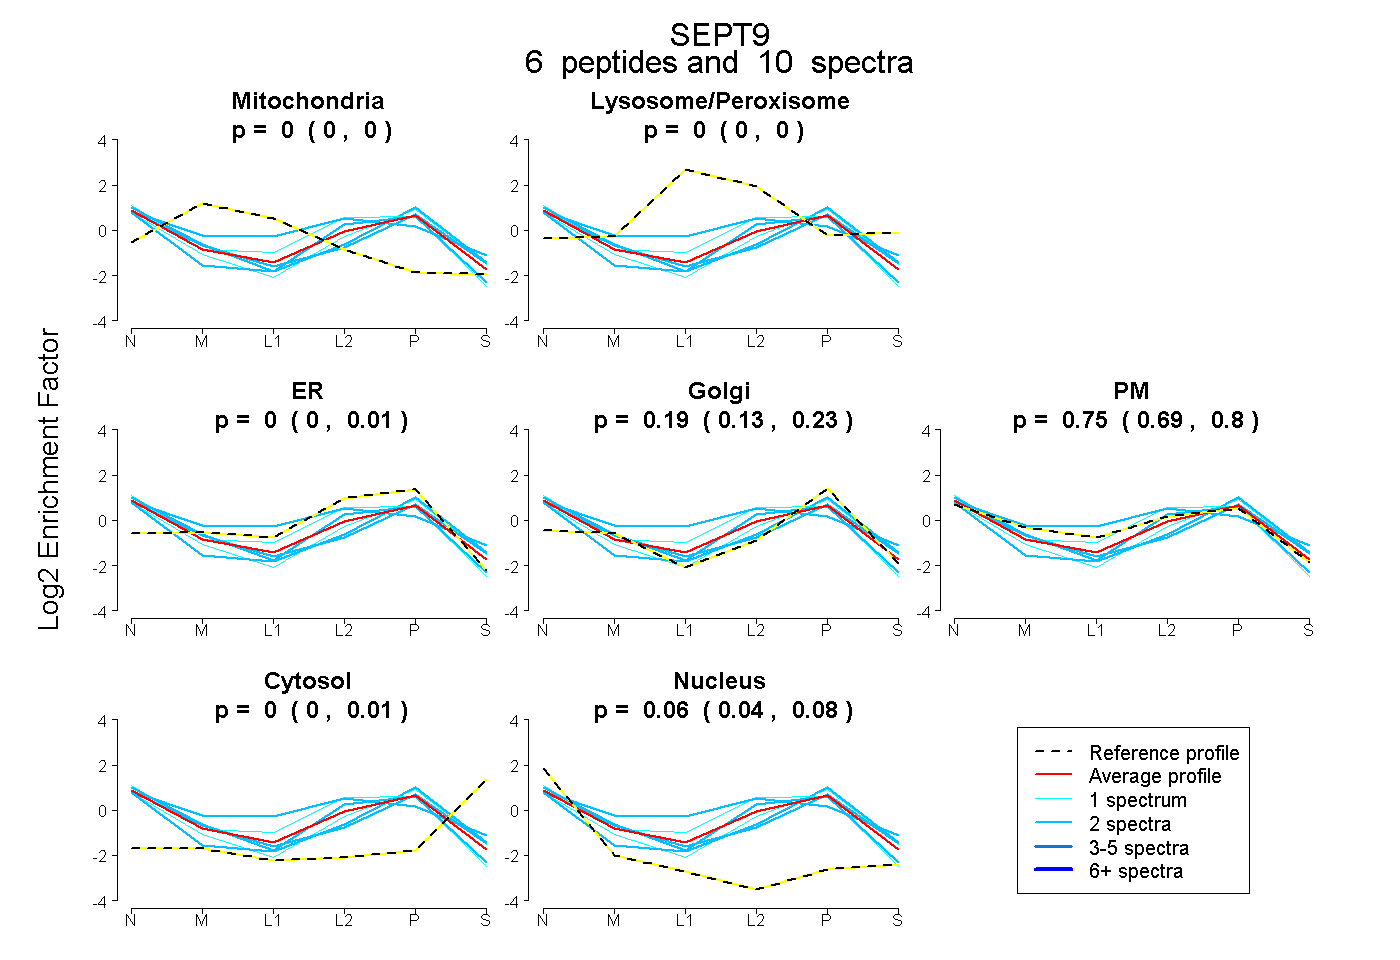
0.000 | 0.000
0.000 | 0.000
0.000 | 0.010
0.127 | 0.225
0.688 | 0.800
0.000 | 0.012
0.043 | 0.081