 15
15peptides
spectra
0.000 | 0.000
0.000 | 0.000
0.000 | 0.000
0.119 | 0.153
0.178 | 0.206
0.353 | 0.382
0.221 | 0.229
0.071 | 0.078
| Plot | Mito | Lyso | Perox | ER | Golgi | PM | Cytosol | Nucleus | |||||
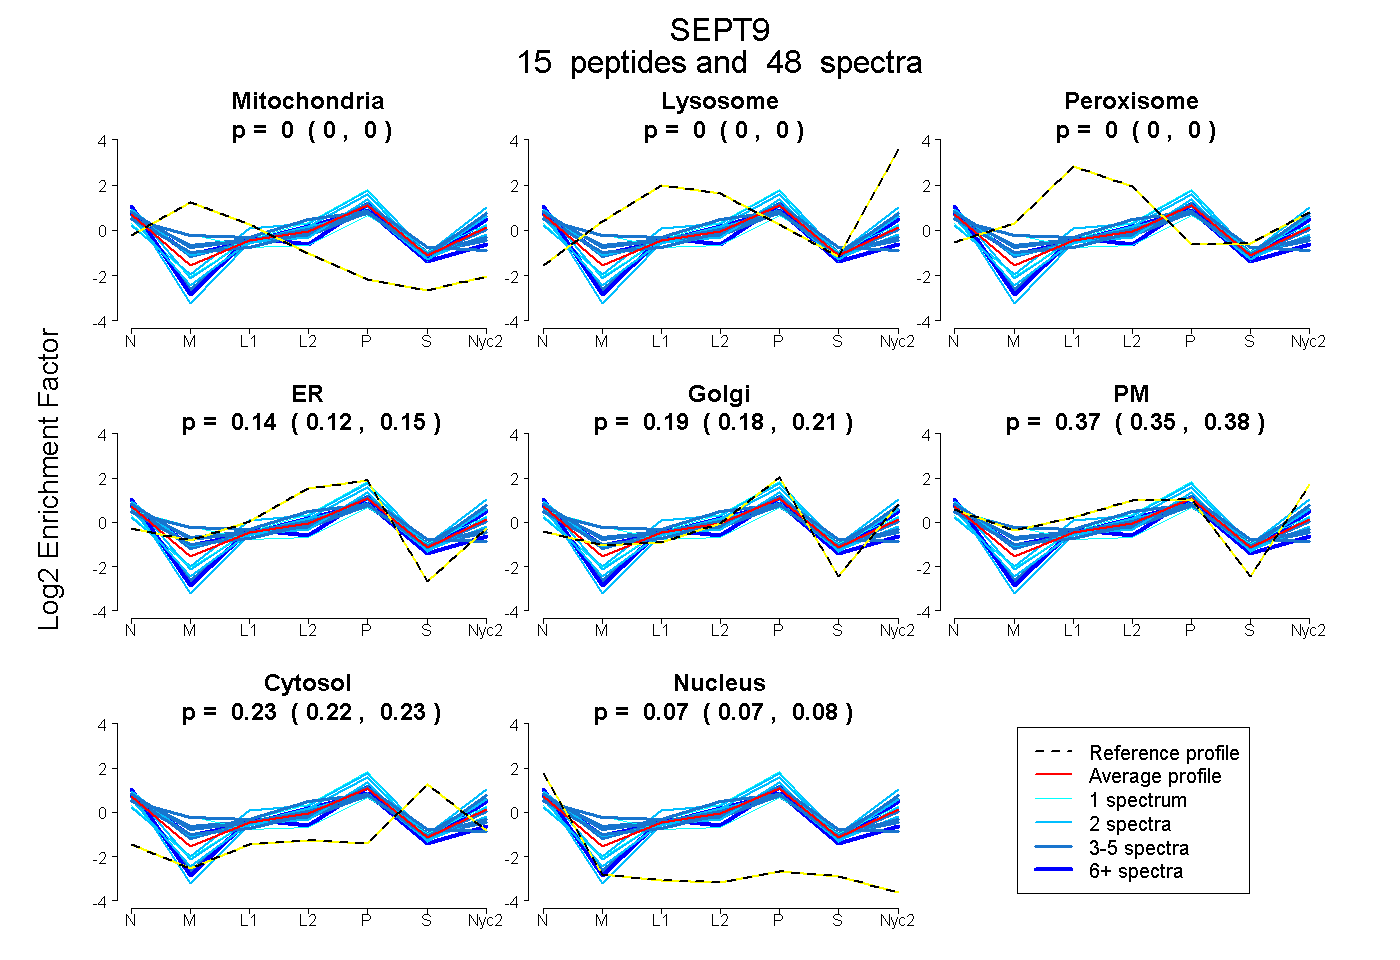
| Expt A |
15 peptides |
48 spectra |
|
0.000 0.000 | 0.000 |
0.000 0.000 | 0.000 |
0.000 0.000 | 0.000 |
0.137 0.119 | 0.153 |
0.193 0.178 | 0.206 |
0.369 0.353 | 0.382 |
0.226 0.221 | 0.229 |
0.075 0.071 | 0.078 |
| 4 spectra, THMQNIK | 0.035 | 0.000 | 0.015 | 0.046 | 0.005 | 0.696 | 0.204 | 0.000 | ||
| 2 spectra, APEPMSR | 0.000 | 0.000 | 0.063 | 0.014 | 0.463 | 0.291 | 0.169 | 0.000 | ||
| 2 spectra, TPEPVPR | 0.000 | 0.000 | 0.000 | 0.060 | 0.473 | 0.144 | 0.210 | 0.113 | ||
| 4 spectra, WGTIEVENTTHCEFAYLR | 0.000 | 0.000 | 0.000 | 0.469 | 0.094 | 0.065 | 0.275 | 0.097 | ||
| 8 spectra, QAPVSR | 0.000 | 0.000 | 0.000 | 0.000 | 0.353 | 0.321 | 0.209 | 0.117 | ||
| 6 spectra, DITSNIHFEAYR | 0.000 | 0.000 | 0.024 | 0.428 | 0.000 | 0.238 | 0.157 | 0.153 | ||
| 1 spectrum, STLINTLFK | 0.125 | 0.000 | 0.000 | 0.000 | 0.258 | 0.359 | 0.228 | 0.030 | ||
| 1 spectrum, NSEPAAR | 0.000 | 0.000 | 0.000 | 0.106 | 0.493 | 0.244 | 0.158 | 0.000 | ||
| 3 spectra, APEGSAMPVTDAAPK | 0.000 | 0.000 | 0.000 | 0.306 | 0.210 | 0.096 | 0.267 | 0.121 | ||
| 2 spectra, QVESTASTPGPSR | 0.000 | 0.000 | 0.000 | 0.088 | 0.444 | 0.230 | 0.237 | 0.002 | ||
| 2 spectra, SVQPISEER | 0.000 | 0.000 | 0.000 | 0.126 | 0.041 | 0.542 | 0.182 | 0.109 | ||
| 3 spectra, FINDQYEK | 0.000 | 0.000 | 0.000 | 0.000 | 0.032 | 0.671 | 0.259 | 0.037 | ||
| 4 spectra, YLQEEVNINR | 0.000 | 0.000 | 0.004 | 0.168 | 0.000 | 0.519 | 0.212 | 0.098 | ||
| 2 spectra, LEPRPPVTEVPYR | 0.000 | 0.000 | 0.000 | 0.085 | 0.277 | 0.290 | 0.191 | 0.156 | ||
| 4 spectra, SITHDIEEK | 0.000 | 0.000 | 0.000 | 0.212 | 0.010 | 0.404 | 0.243 | 0.131 |
| Plot | Mito | Lyso or Perox | ER | Golgi | PM | Cytosol | Nucleus | ||||||
| Expt B |
6 peptides |
10 spectra |
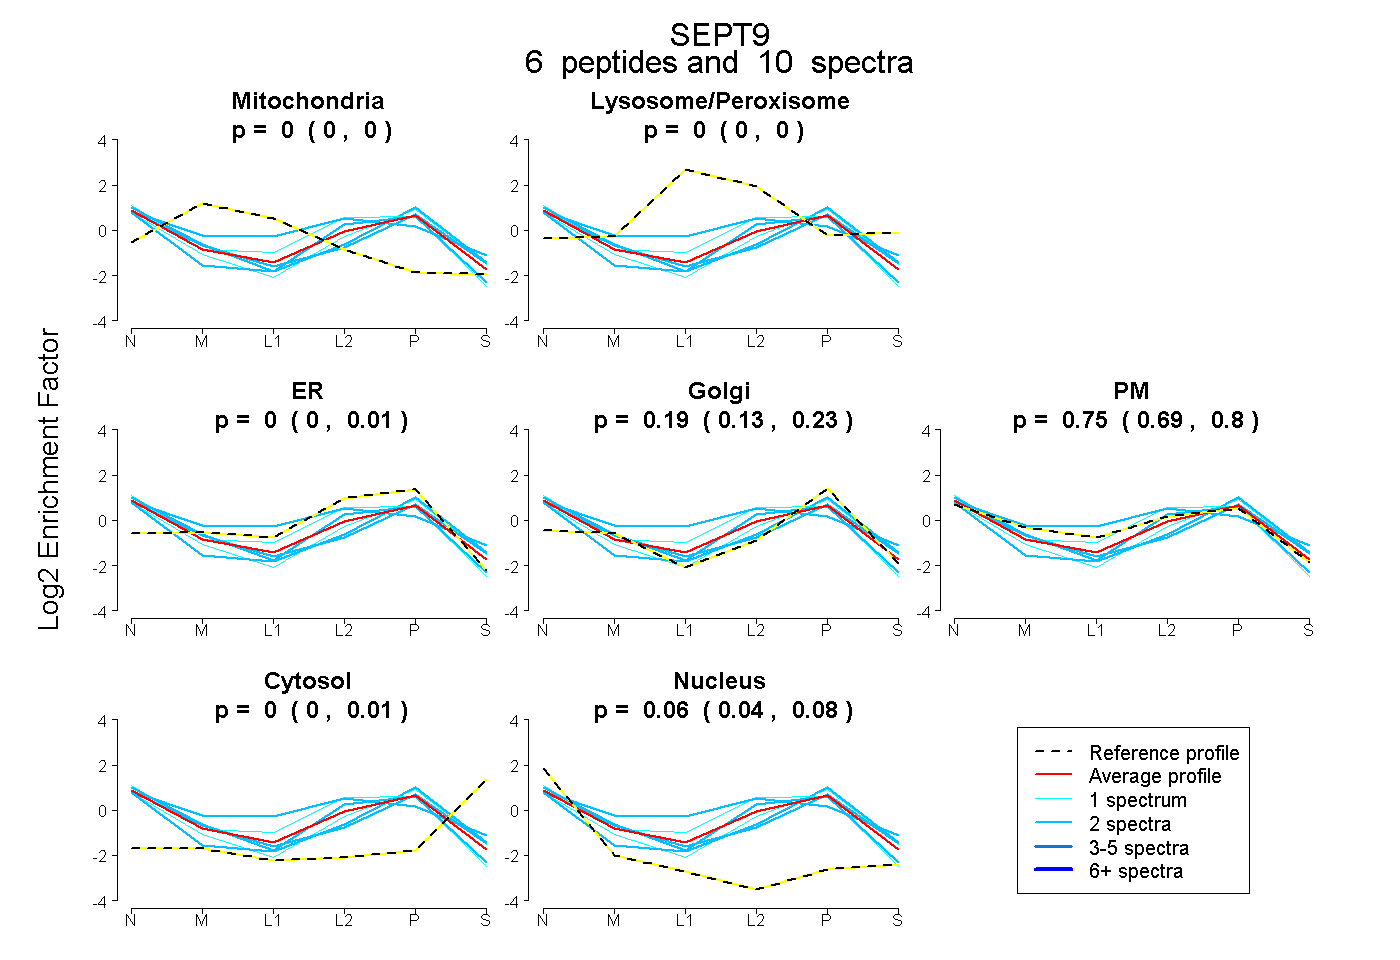 |
0.000 0.000 | 0.000 |
0.000 0.000 | 0.000 |
0.000 0.000 | 0.010 |
0.185 0.127 | 0.225 |
0.750 0.688 | 0.800 |
0.000 0.000 | 0.012 |
0.065 0.043 | 0.081 |
|||
| Plot | Lyso | Other | |||||||||||
| Expt C |
18 peptides |
62 spectra |
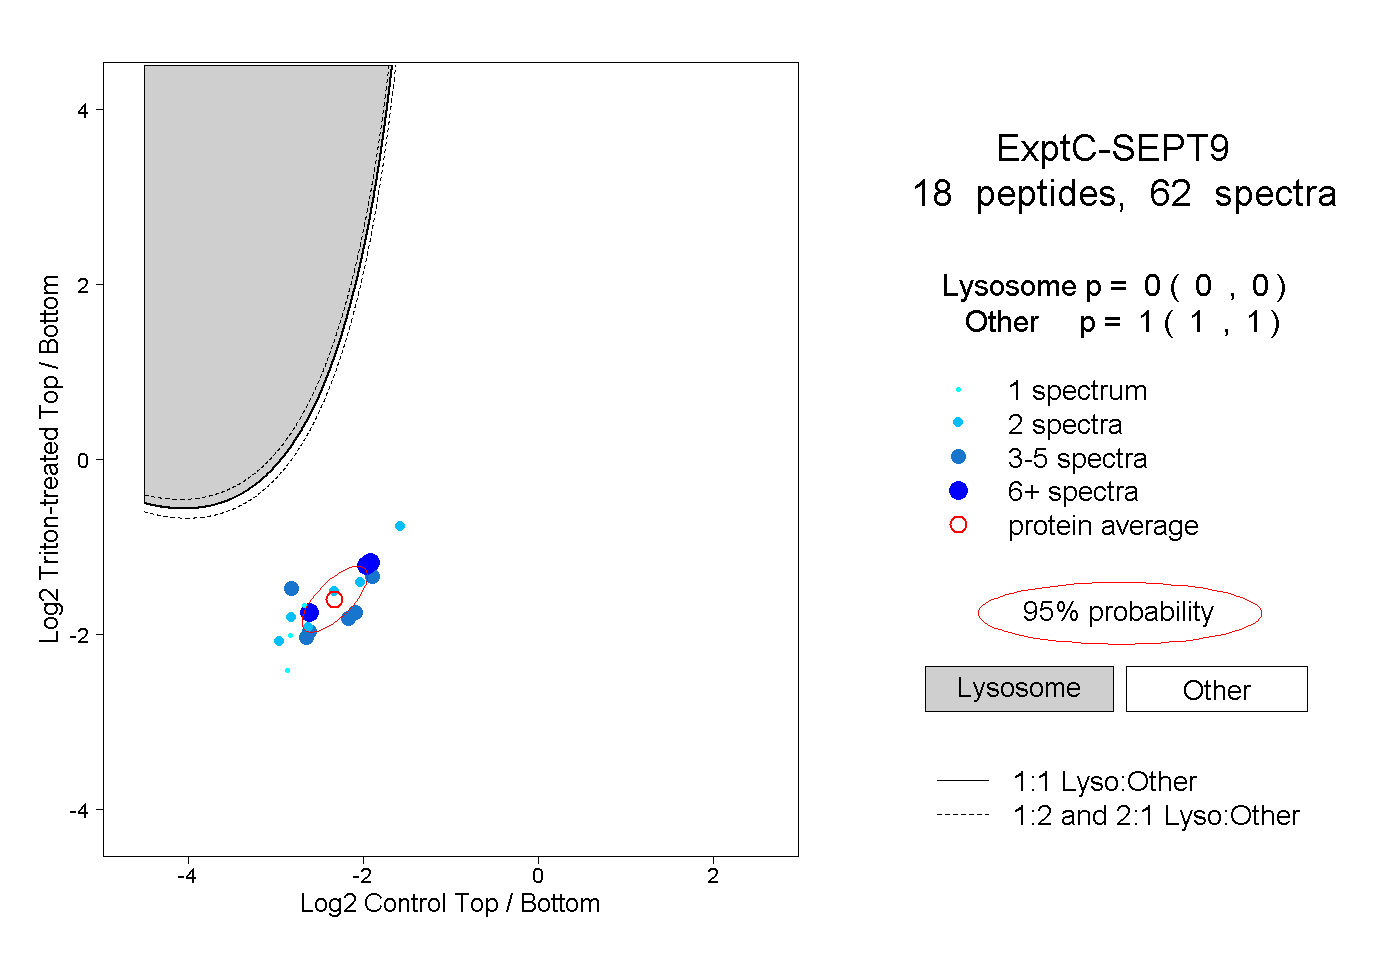 |
0.000 0.000 | 0.000 |
1.000 1.000 | 1.000 |
||||||||
| Plot | Lyso | Other | |||||||||||
| Expt D |
5 peptides |
9 spectra |
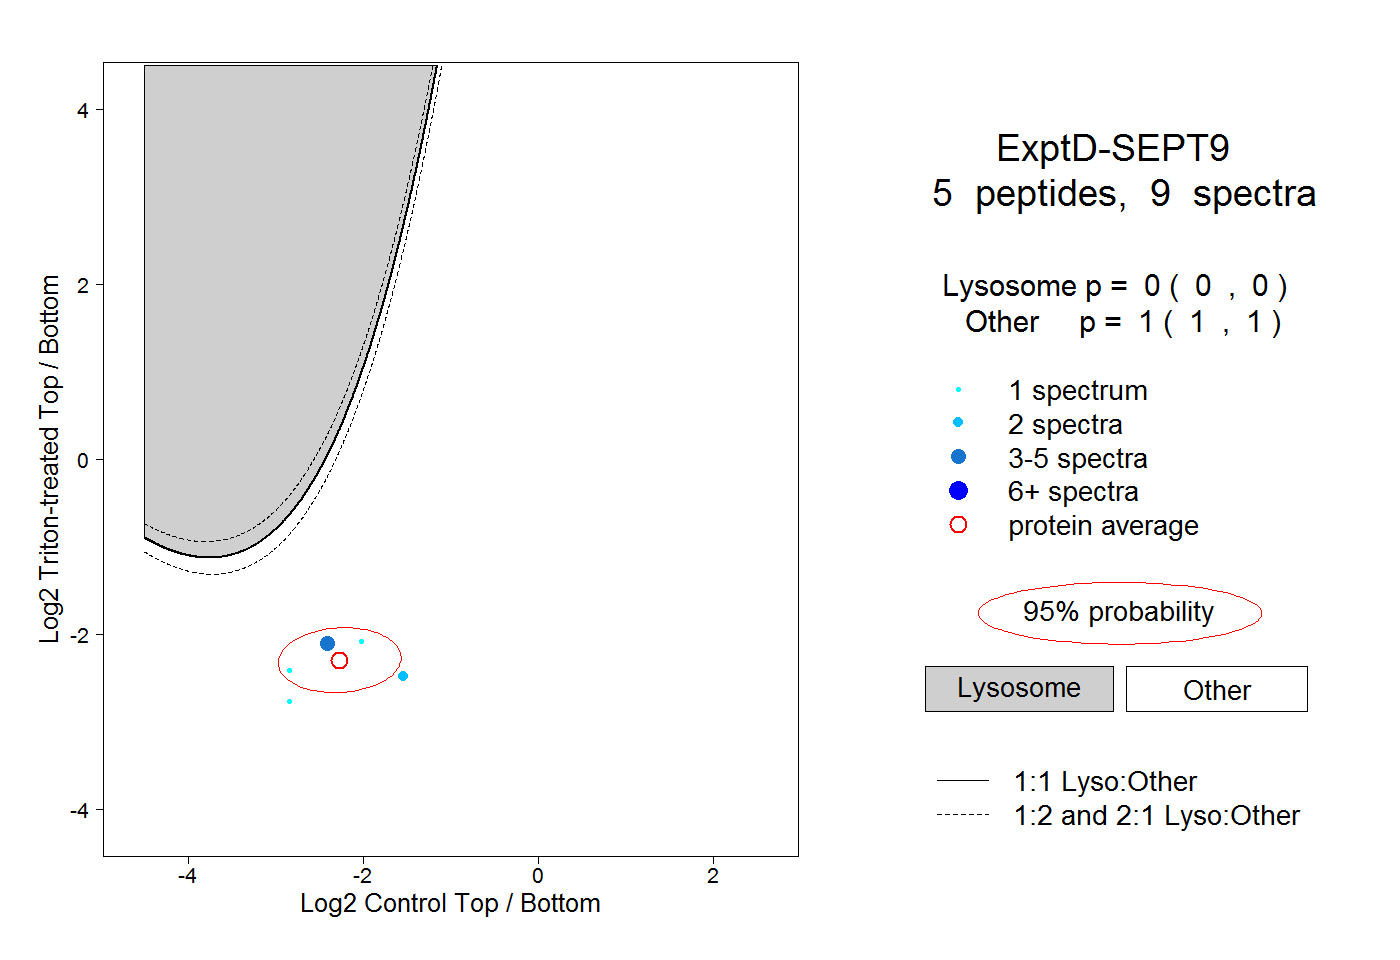 |
0.000 0.000 | 0.000 |
1.000 1.000 | 1.000 |