 7
7peptides
spectra
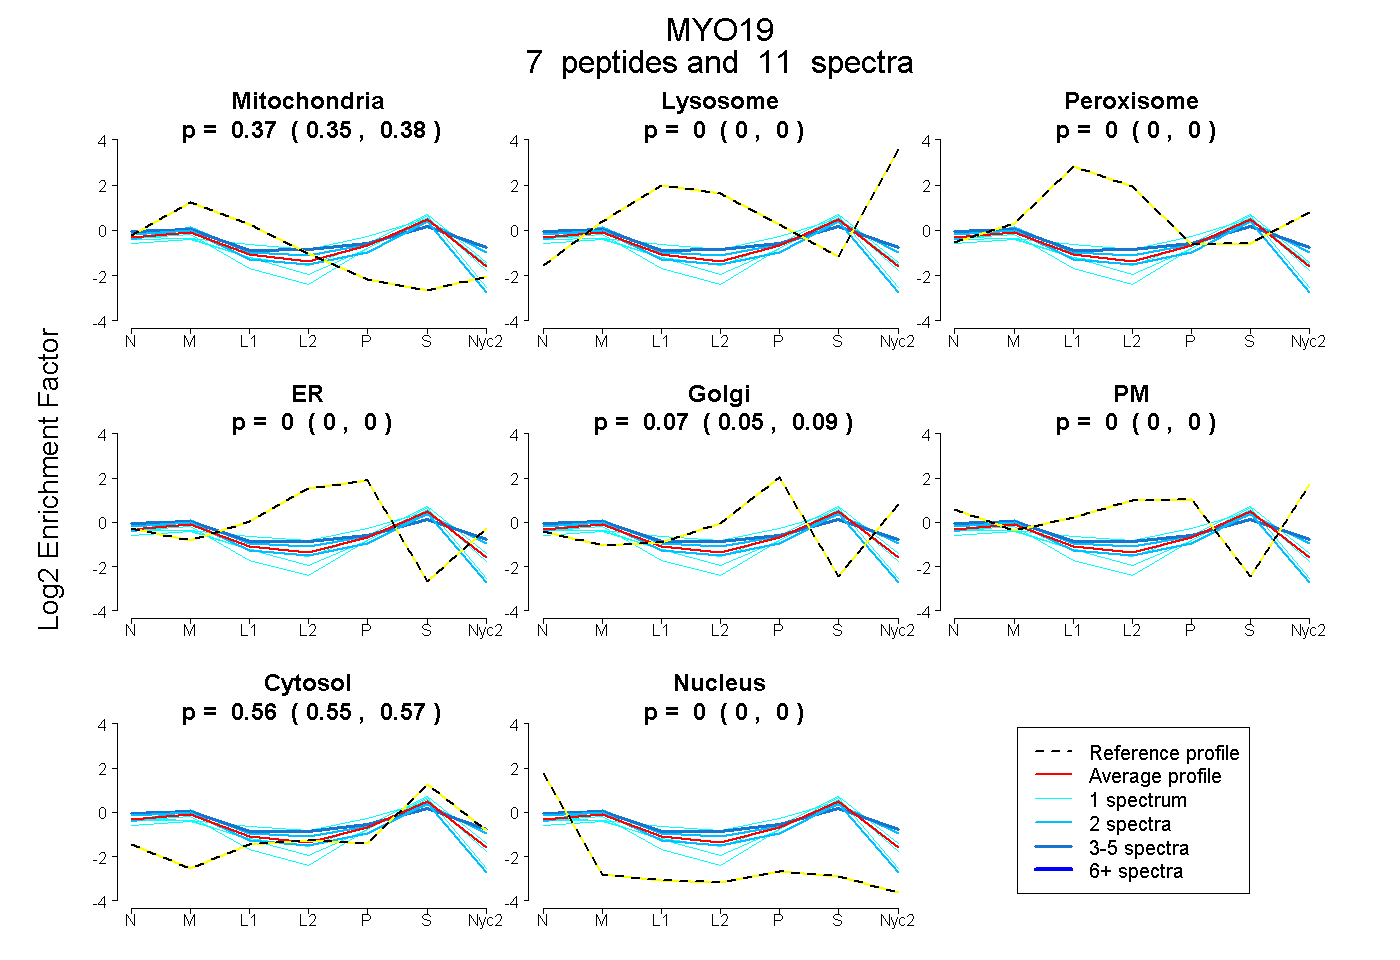
0.352 | 0.384
0.000 | 0.000
0.000 | 0.000
0.000 | 0.000
0.051 | 0.088
0.000 | 0.000
0.549 | 0.568
0.000 | 0.000
1peptide
spectrum
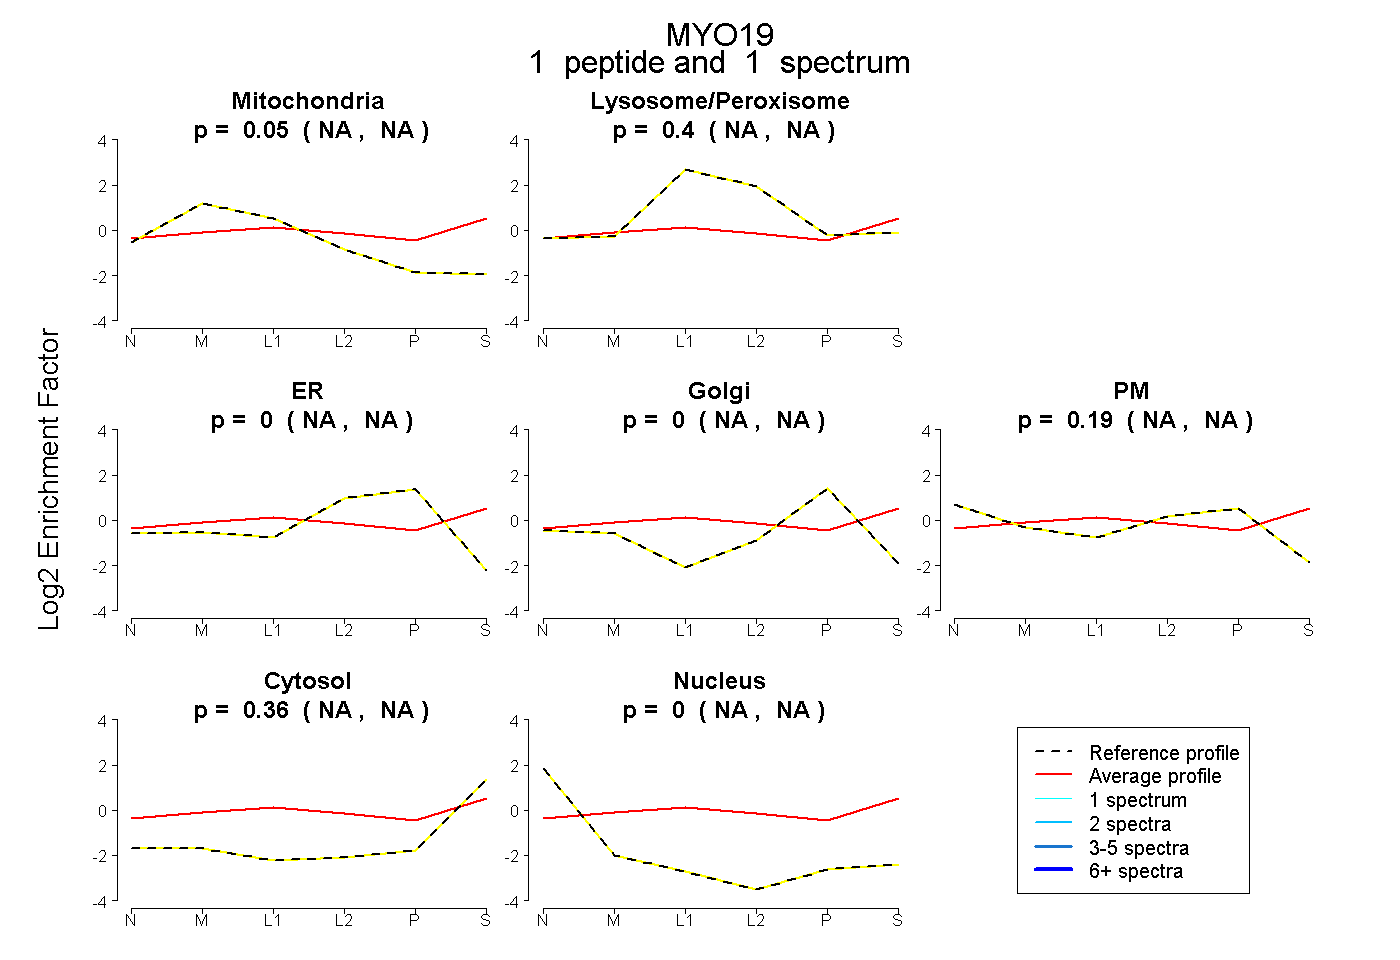
NA | NA
NA | NA
NA | NA
NA | NA
NA | NA
NA | NA
NA | NA
1peptide
spectra
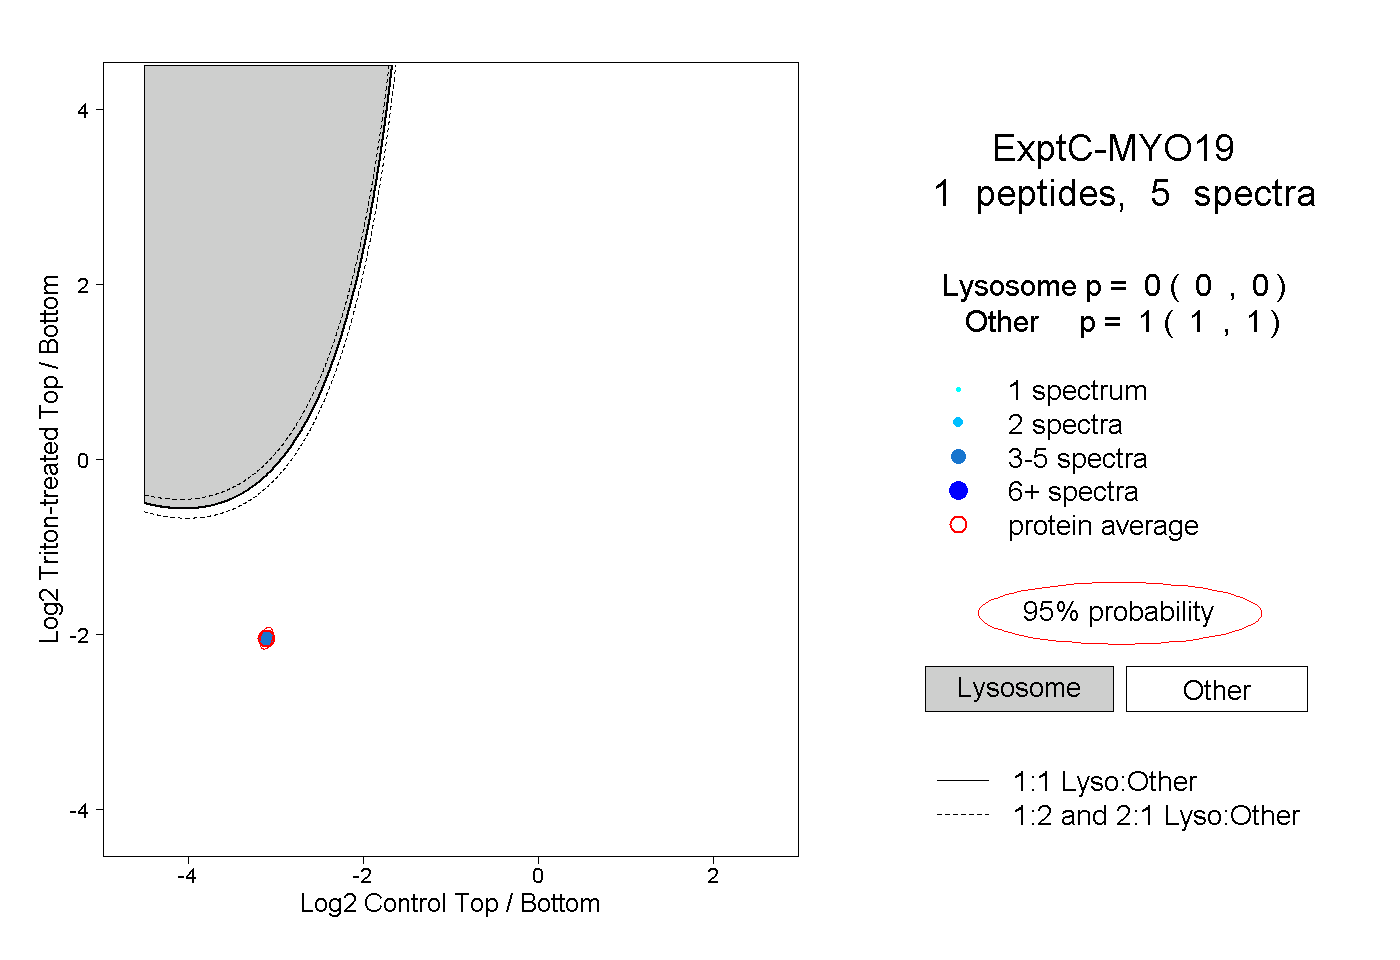
0.000 | 0.000
1.000 | 1.000