34
34peptides
spectra
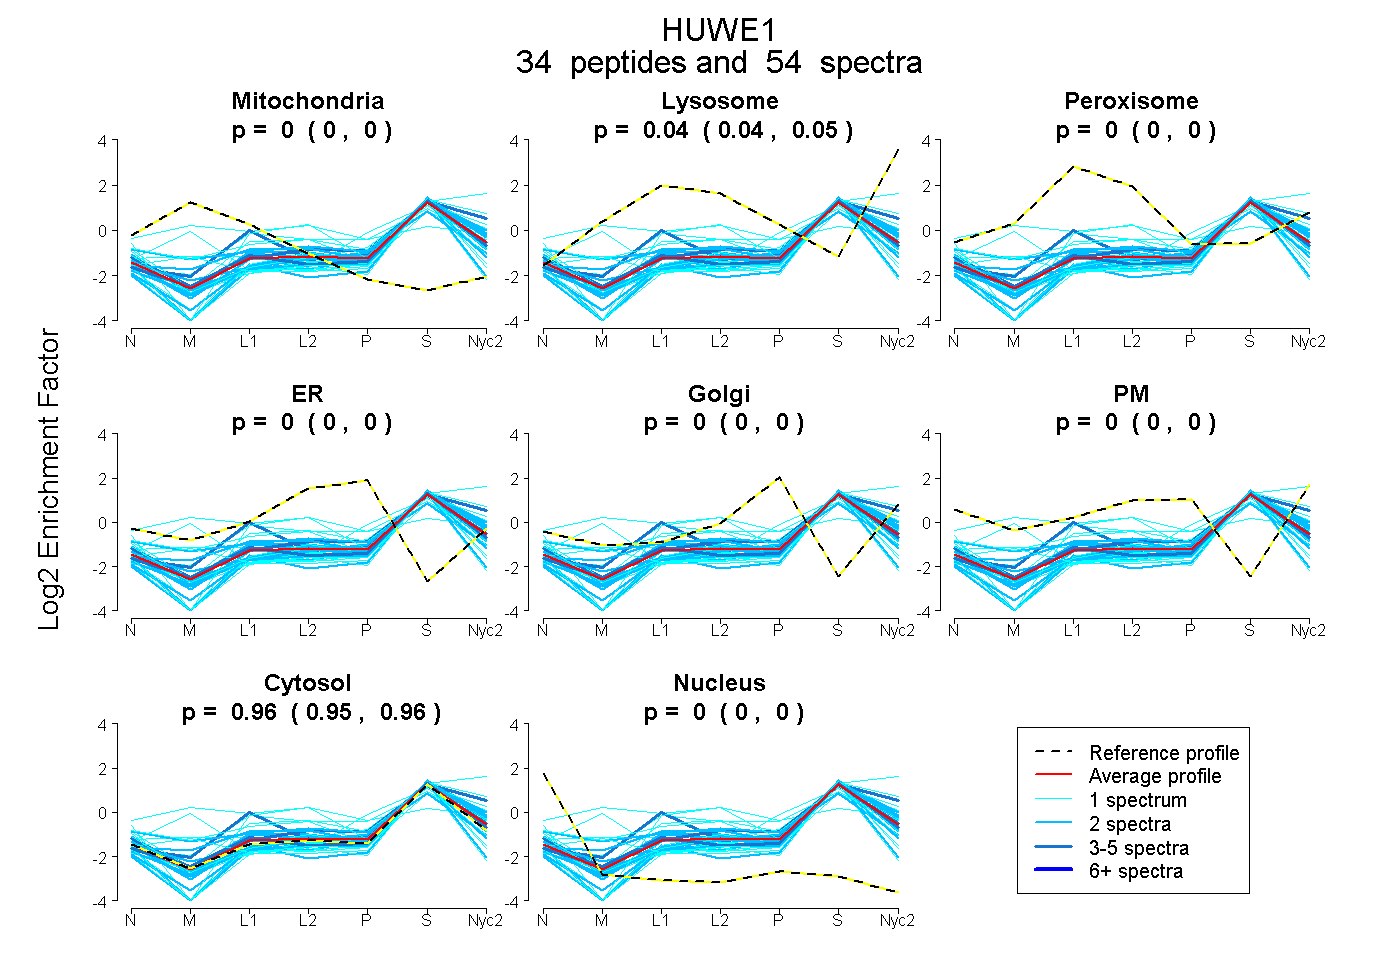
0.000 | 0.000
0.040 | 0.047
0.000 | 0.000
0.000 | 0.000
0.000 | 0.000
0.000 | 0.000
0.952 | 0.959
0.000 | 0.000
6peptides
spectra
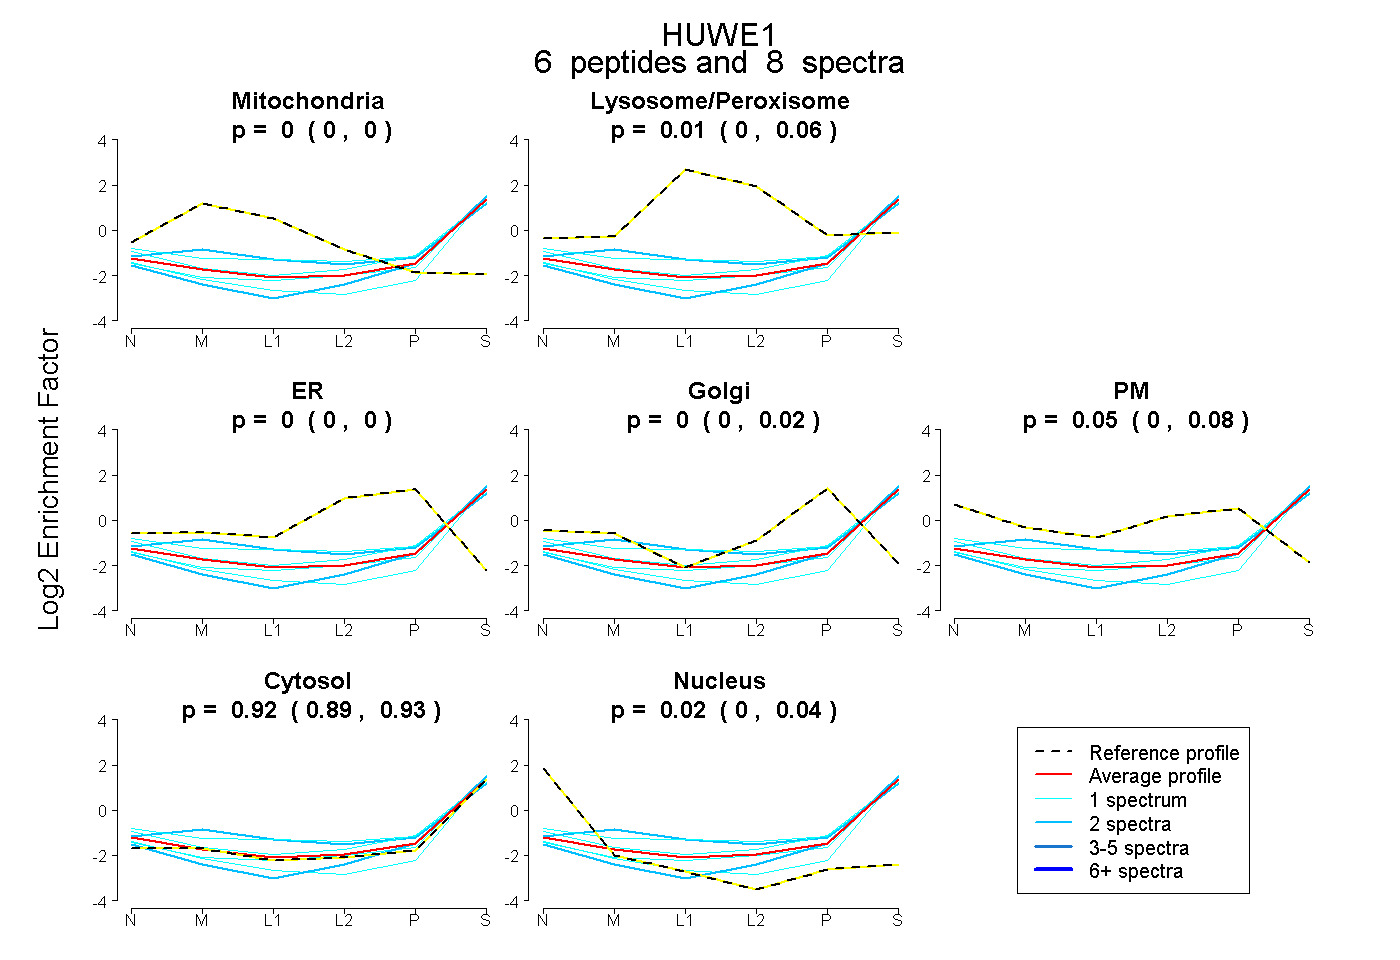
0.000 | 0.000
0.000 | 0.059
0.000 | 0.000
0.000 | 0.019
0.000 | 0.080
0.891 | 0.930
0.000 | 0.042