 4
4peptides
spectra
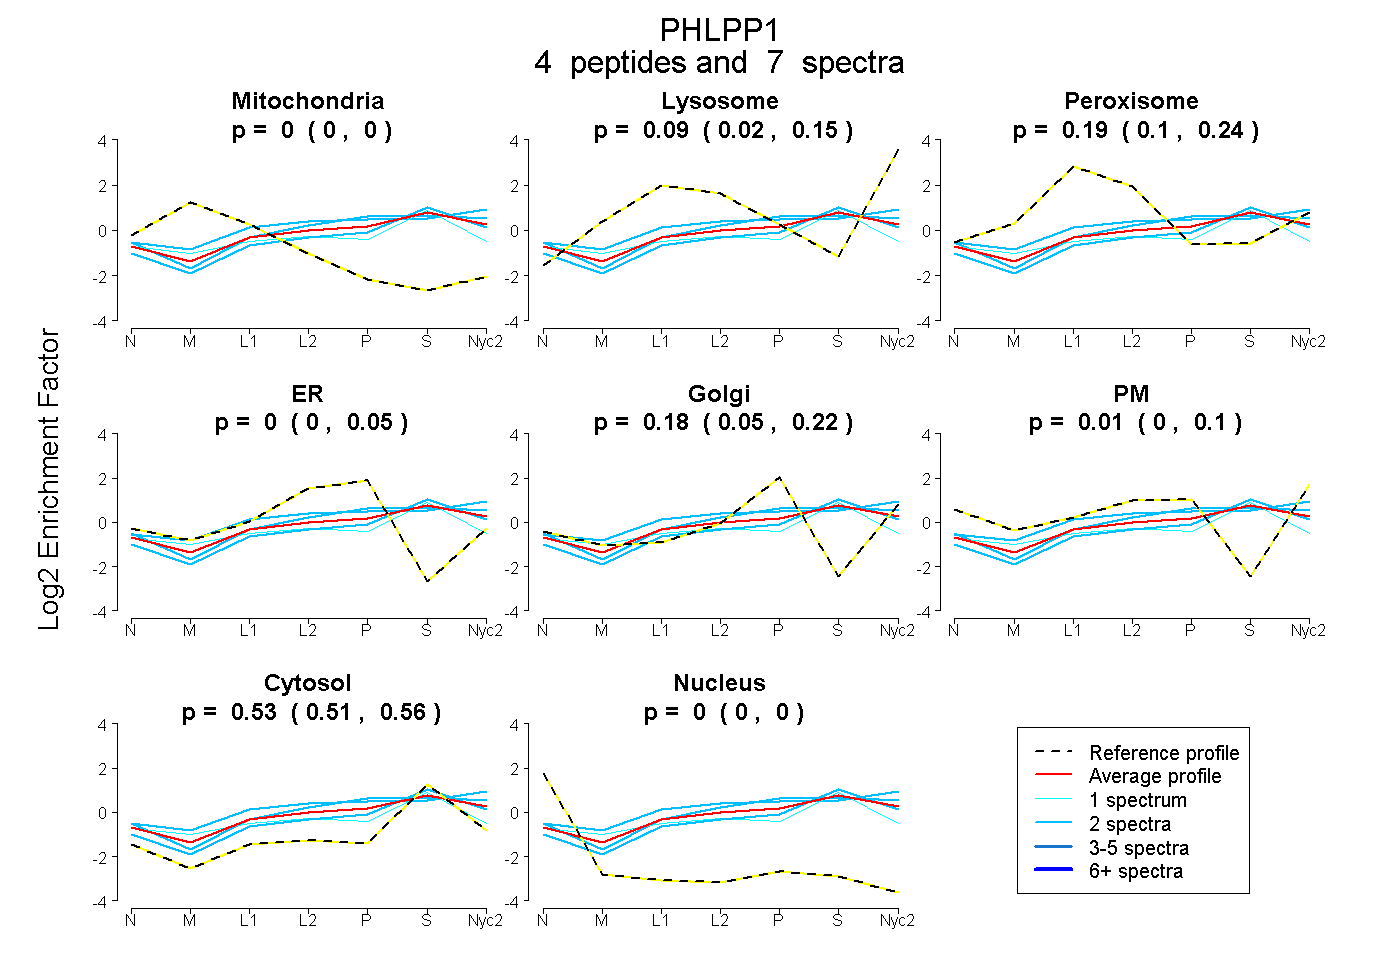
0.000 | 0.000
0.017 | 0.146
0.098 | 0.237
0.000 | 0.054
0.054 | 0.218
0.000 | 0.098
0.506 | 0.564
0.000 | 0.000
| Plot | Mito | Lyso | Perox | ER | Golgi | PM | Cytosol | Nucleus | |||||
| Expt A |
4 peptides |
7 spectra |
|
0.000 0.000 | 0.000 |
0.088 0.017 | 0.146 |
0.185 0.098 | 0.237 |
0.000 0.000 | 0.054 |
0.185 0.054 | 0.218 |
0.009 0.000 | 0.098 |
0.532 0.506 | 0.564 |
0.000 0.000 | 0.000 |
| 2 spectra, ILHMAYNR | 0.000 | 0.208 | 0.177 | 0.000 | 0.137 | 0.090 | 0.388 | 0.000 | ||
| 1 spectrum, LGGAAVLCHIR | 0.010 | 0.000 | 0.242 | 0.047 | 0.077 | 0.000 | 0.624 | 0.000 | ||
| 2 spectra, EALYGVFDGDR | 0.000 | 0.151 | 0.059 | 0.093 | 0.117 | 0.078 | 0.502 | 0.000 | ||
| 2 spectra, LLAGHNR | 0.000 | 0.161 | 0.019 | 0.062 | 0.066 | 0.000 | 0.691 | 0.000 |
| Plot | Lyso | Other | |||||||||||
| Expt C |
2 peptides |
3 spectra |
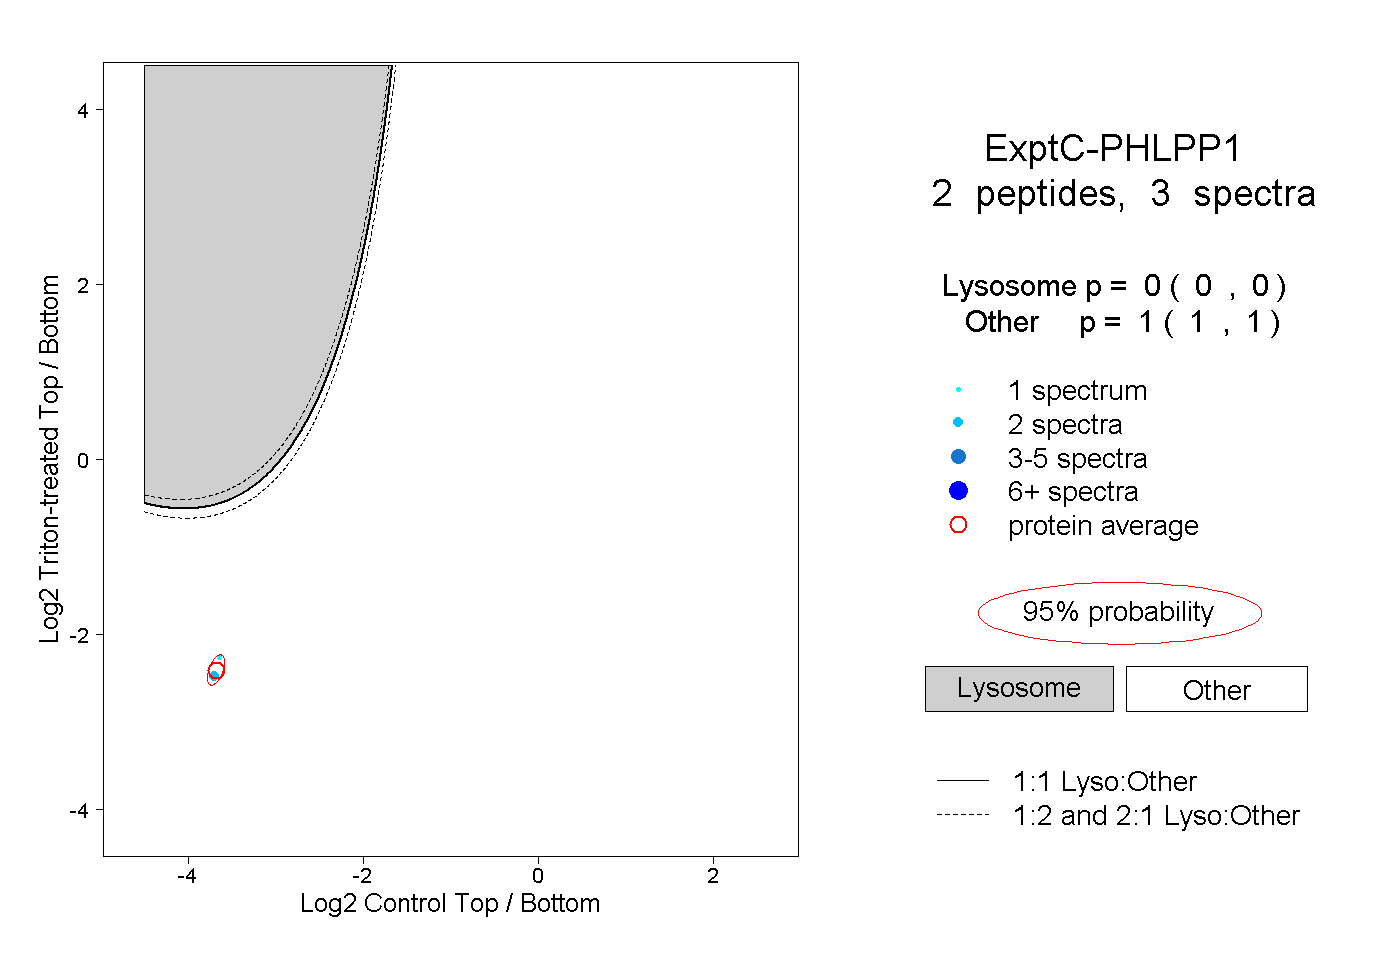 |
0.000 0.000 | 0.000 |
1.000 1.000 | 1.000 |