 3
3peptides
spectra
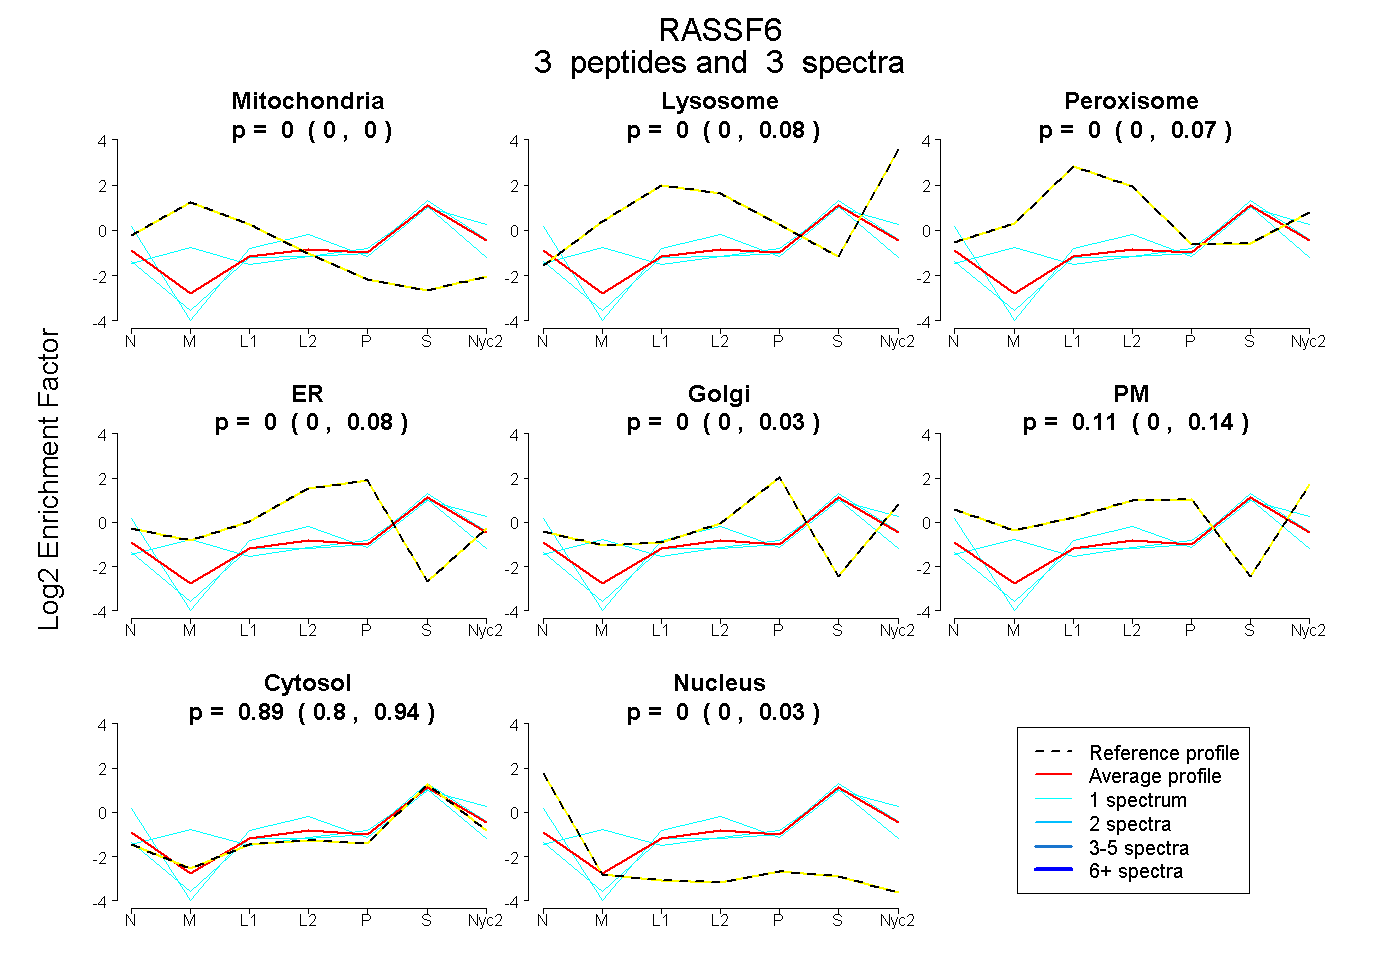
0.000 | 0.000
0.000 | 0.085
0.000 | 0.073
0.000 | 0.076
0.000 | 0.034
0.000 | 0.144
0.796 | 0.942
0.000 | 0.029
2peptides
spectra
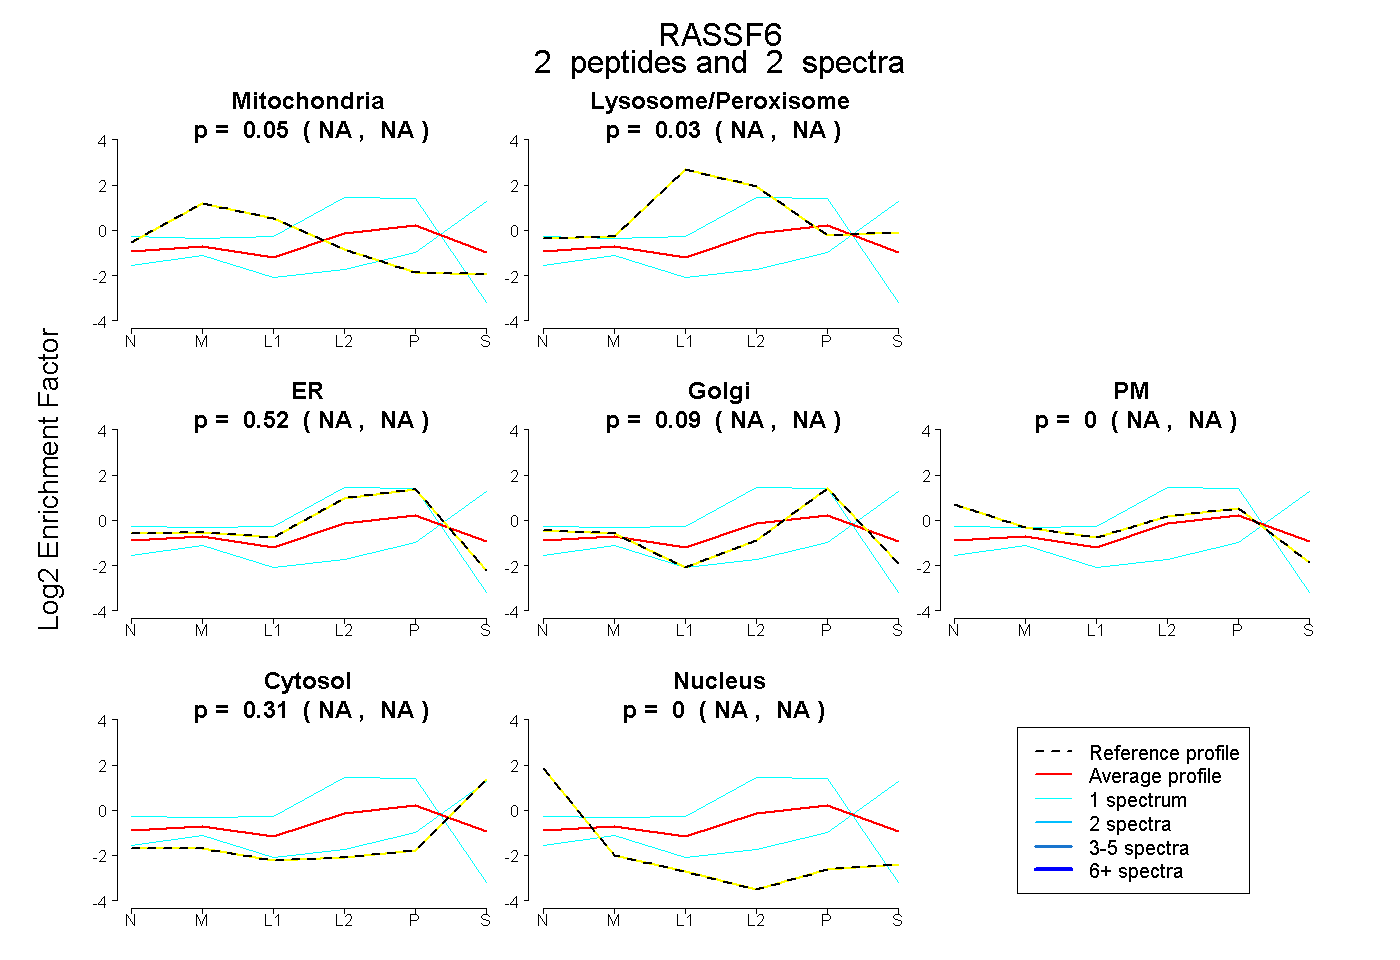
NA | NA
NA | NA
NA | NA
NA | NA
NA | NA
NA | NA
NA | NA
1peptide
spectrum
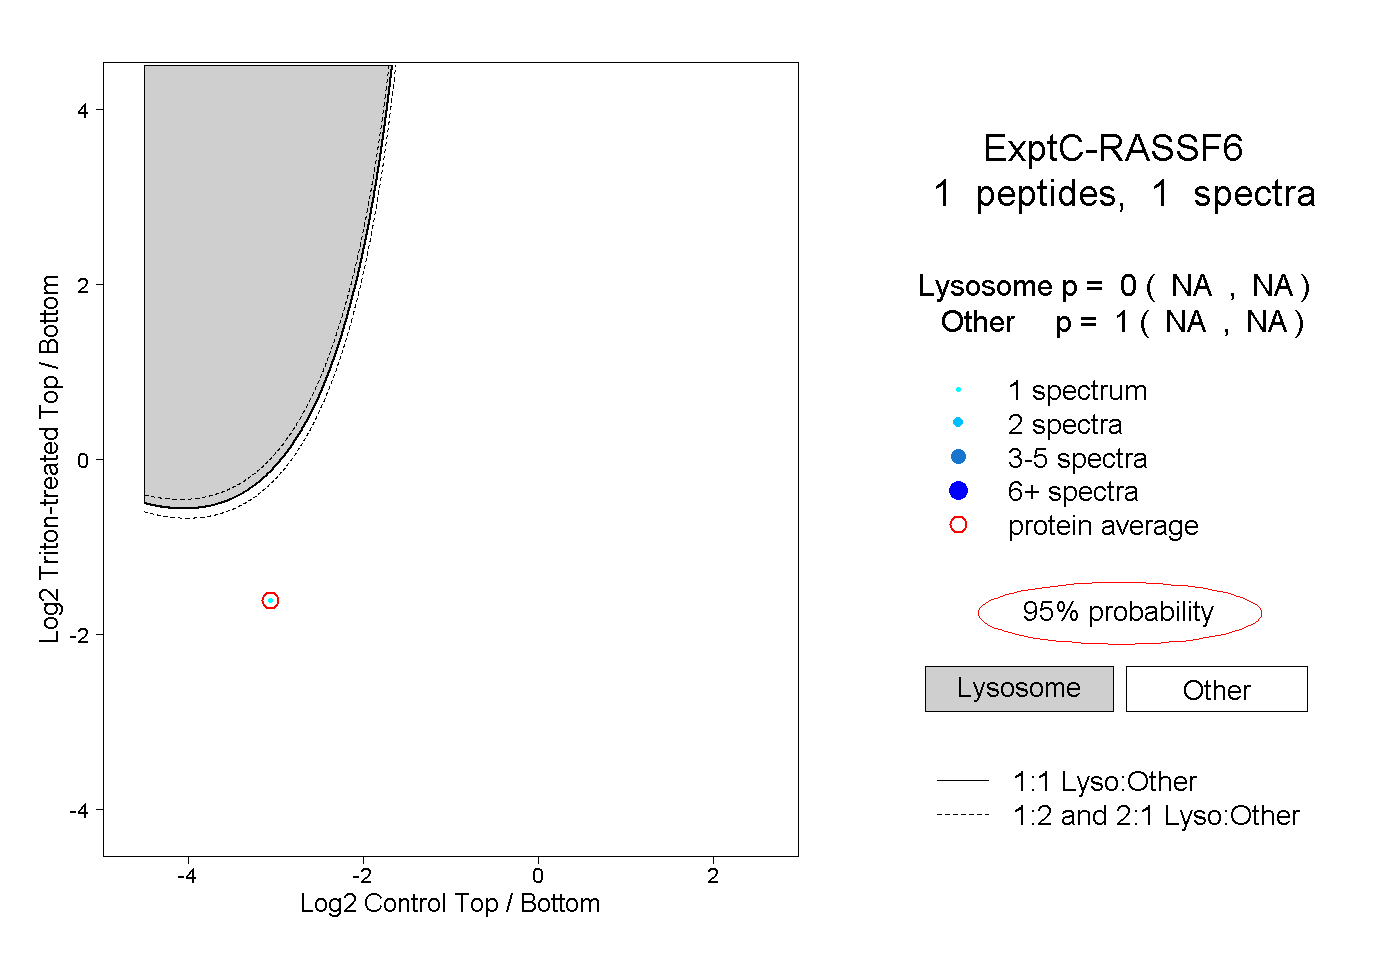
NA | NA
NA | NA