 5
5peptides
spectra
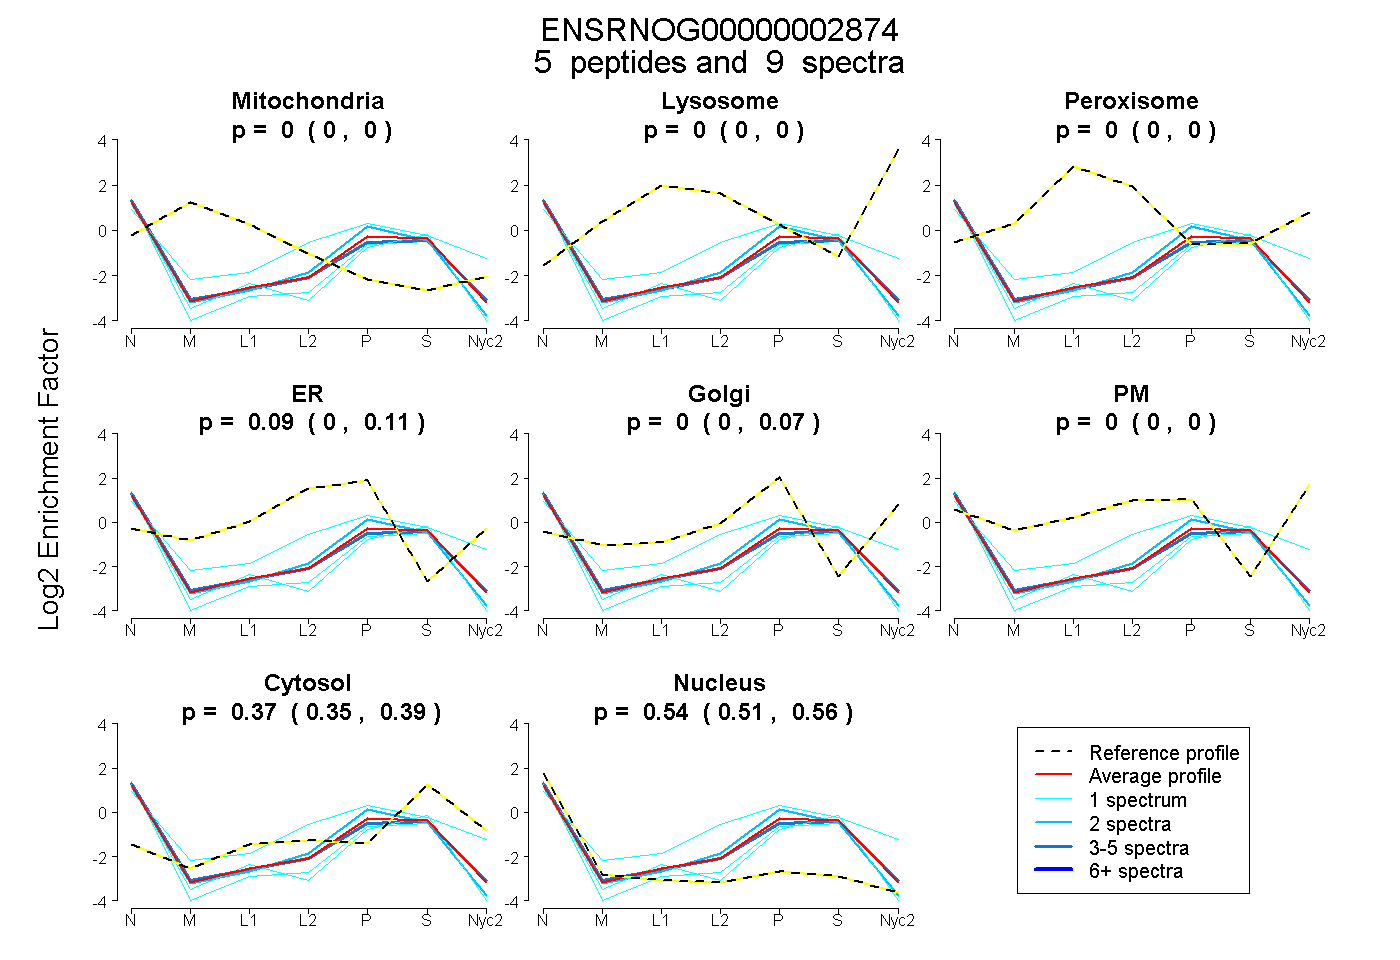
0.000 | 0.000
0.000 | 0.000
0.000 | 0.000
0.000 | 0.106
0.000 | 0.067
0.000 | 0.000
0.355 | 0.386
0.511 | 0.564
| Plot | Mito | Lyso | Perox | ER | Golgi | PM | Cytosol | Nucleus | |||||
| Expt A |
5 peptides |
9 spectra |
|
0.000 0.000 | 0.000 |
0.000 0.000 | 0.000 |
0.000 0.000 | 0.000 |
0.086 0.000 | 0.106 |
0.000 0.000 | 0.067 |
0.000 0.000 | 0.000 |
0.374 0.355 | 0.386 |
0.540 0.511 | 0.564 |
| 1 spectrum, MEQEAER | 0.000 | 0.000 | 0.000 | 0.228 | 0.143 | 0.007 | 0.399 | 0.223 | ||
| 2 spectra, LLAEGHPDPDAELQR | 0.000 | 0.000 | 0.000 | 0.123 | 0.000 | 0.000 | 0.313 | 0.564 | ||
| 1 spectrum, LLIYETEAK | 0.000 | 0.000 | 0.000 | 0.000 | 0.000 | 0.000 | 0.359 | 0.641 | ||
| 4 spectra, IRPWINK | 0.000 | 0.000 | 0.000 | 0.075 | 0.000 | 0.000 | 0.369 | 0.556 | ||
| 1 spectrum, GTVNTEEK | 0.000 | 0.000 | 0.000 | 0.000 | 0.000 | 0.000 | 0.324 | 0.676 |