 5
5peptides
spectra
0.000 | 0.000
0.000 | 0.000
0.000 | 0.000
0.200 | 0.331
0.000 | 0.130
0.000 | 0.000
0.281 | 0.312
0.335 | 0.401
1peptide
spectrum
NA | NA
NA | NA
NA | NA
NA | NA
NA | NA
NA | NA
NA | NA
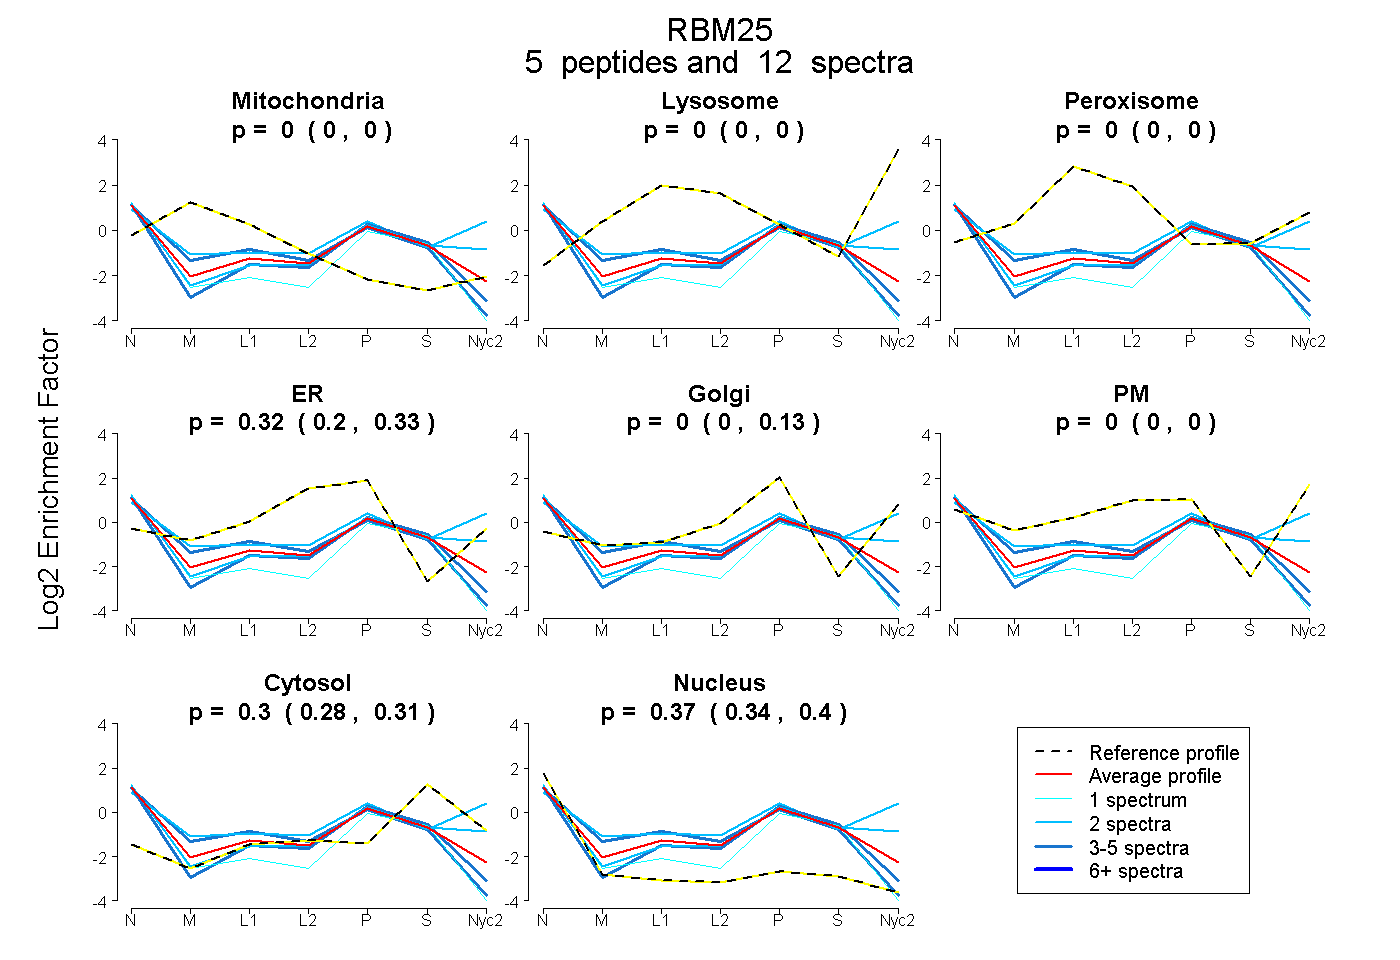
| Plot | Mito | Lyso | Perox | ER | Golgi | PM | Cytosol | Nucleus | |||||
| Expt A |
5 peptides |
12 spectra |
|
0.000 0.000 | 0.000 |
0.000 0.000 | 0.000 |
0.000 0.000 | 0.000 |
0.322 0.200 | 0.331 |
0.000 0.000 | 0.130 |
0.000 0.000 | 0.000 |
0.304 0.281 | 0.312 |
0.374 0.335 | 0.401 |
||
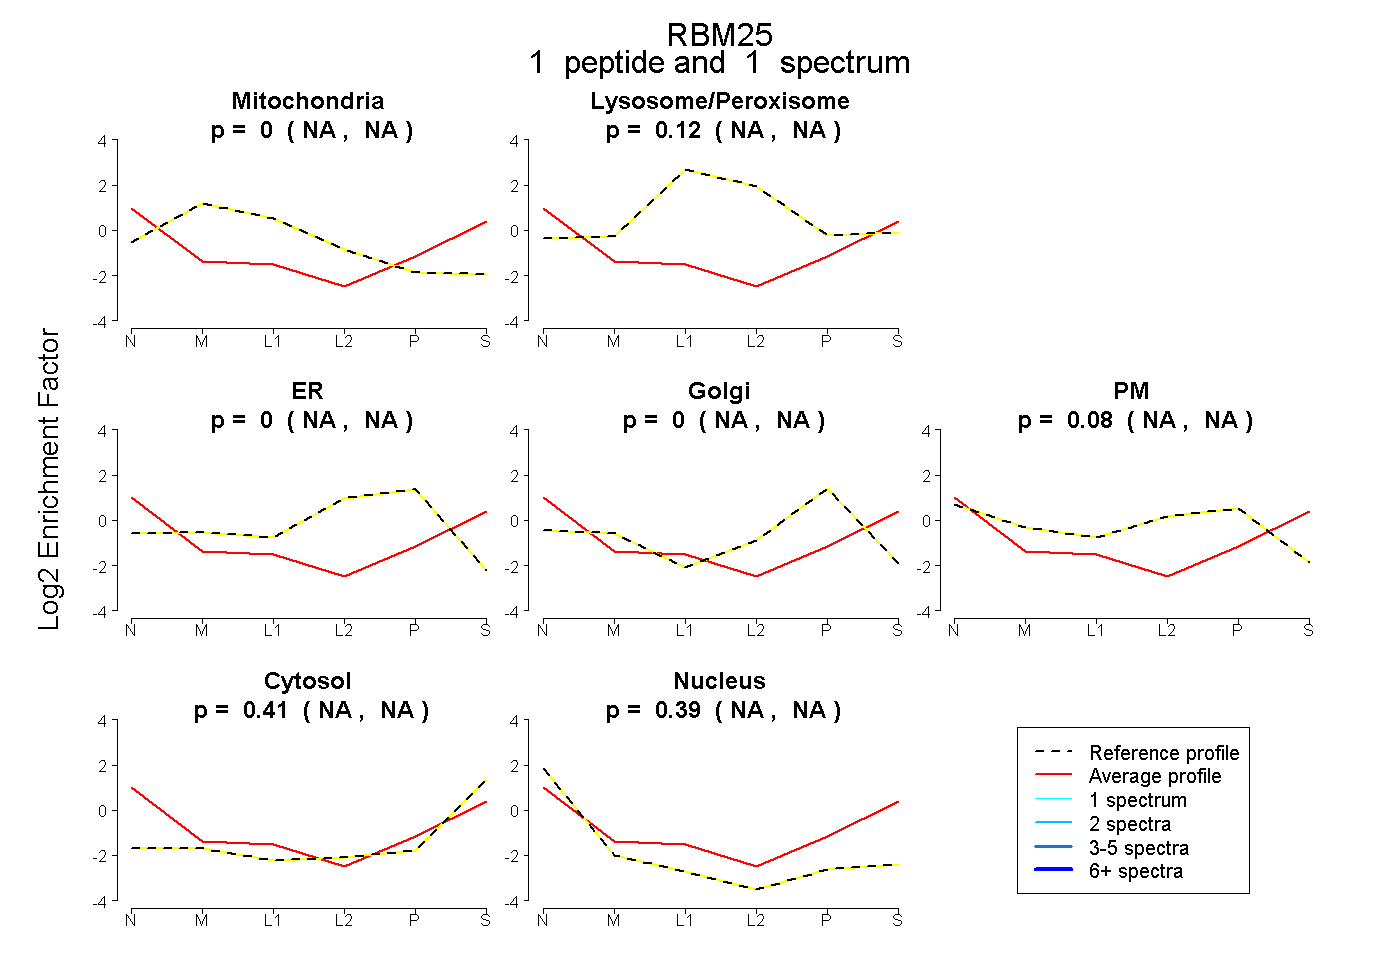
| Plot | Mito | Lyso or Perox | ER | Golgi | PM | Cytosol | Nucleus | ||||||
| Expt B |
1 peptide |
1 spectrum |
|
0.000 NA | NA |
0.121 NA | NA |
0.000 NA | NA |
0.000 NA | NA |
0.076 NA | NA |
0.411 NA | NA |
0.393 NA | NA |