 6
6peptides
spectra
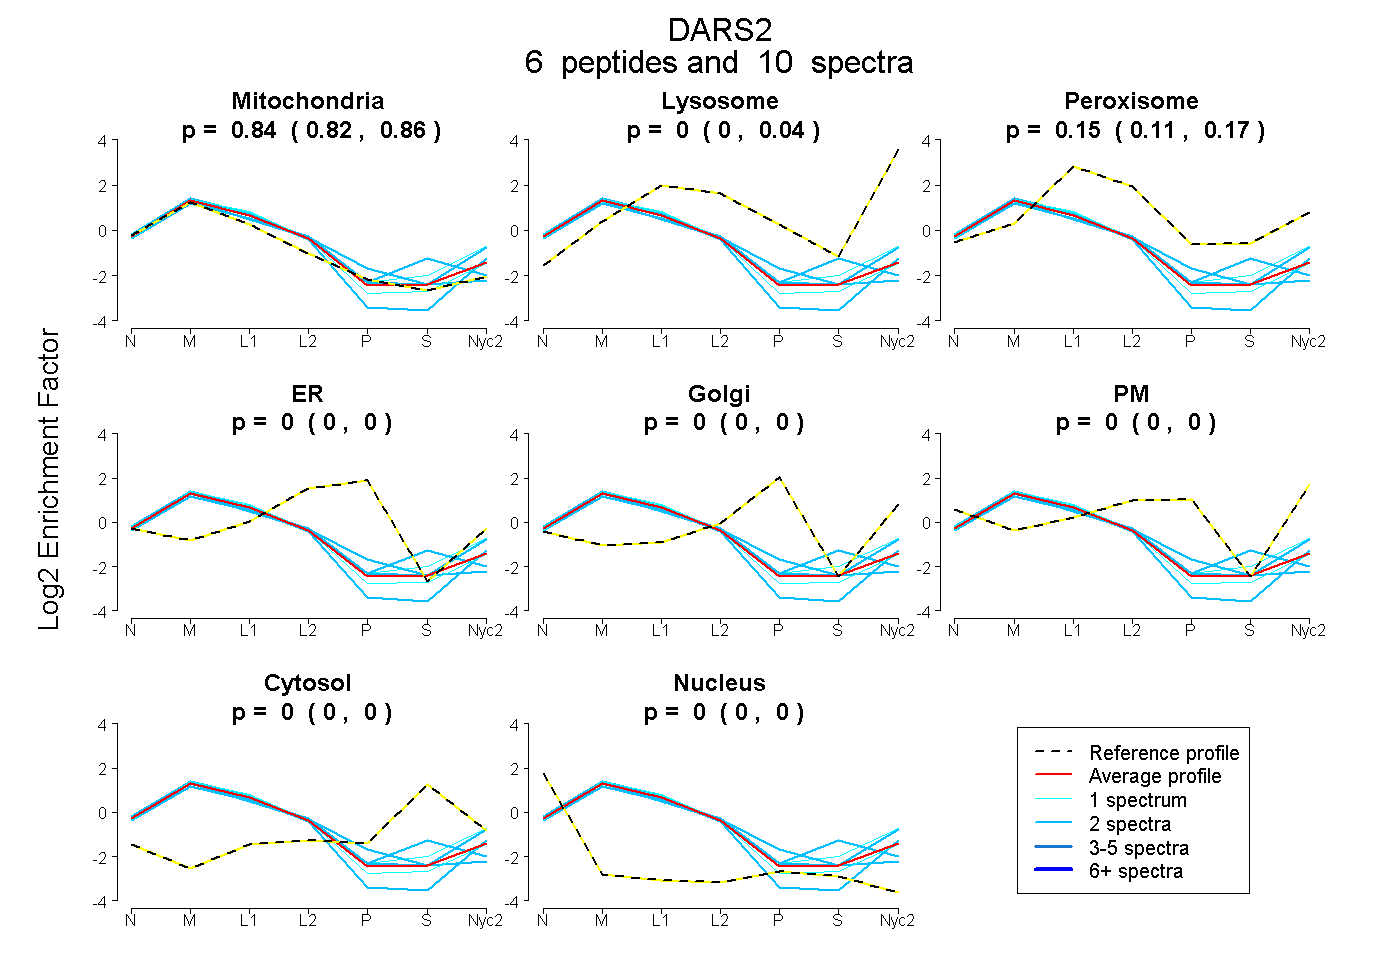
0.825 | 0.862
0.000 | 0.036
0.111 | 0.168
0.000 | 0.000
0.000 | 0.000
0.000 | 0.000
0.000 | 0.000
0.000 | 0.000
| Plot | Mito | Lyso | Perox | ER | Golgi | PM | Cytosol | Nucleus | |||||
| Expt A |
6 peptides |
10 spectra |
|
0.843 0.825 | 0.862 |
0.002 0.000 | 0.036 |
0.155 0.111 | 0.168 |
0.000 0.000 | 0.000 |
0.000 0.000 | 0.000 |
0.000 0.000 | 0.000 |
0.000 0.000 | 0.000 |
0.000 0.000 | 0.000 |
| 2 spectra, LVCLVTGAPSIR | 0.754 | 0.000 | 0.151 | 0.000 | 0.000 | 0.000 | 0.094 | 0.000 | ||
| 1 spectrum, EDIEFIR | 0.749 | 0.107 | 0.143 | 0.000 | 0.000 | 0.000 | 0.000 | 0.000 | ||
| 2 spectra, LECADLLETR | 0.917 | 0.000 | 0.083 | 0.000 | 0.000 | 0.000 | 0.000 | 0.000 | ||
| 2 spectra, FITEEER | 0.773 | 0.185 | 0.000 | 0.000 | 0.000 | 0.043 | 0.000 | 0.000 | ||
| 1 spectrum, TLCEAPVESVVR | 0.874 | 0.000 | 0.126 | 0.000 | 0.000 | 0.000 | 0.000 | 0.000 | ||
| 2 spectra, DEGSRPDR | 0.957 | 0.043 | 0.000 | 0.000 | 0.000 | 0.000 | 0.000 | 0.000 |
| Plot | Mito | Lyso or Perox | ER | Golgi | PM | Cytosol | Nucleus | ||||||
| Expt B |
1 peptide |
1 spectrum |
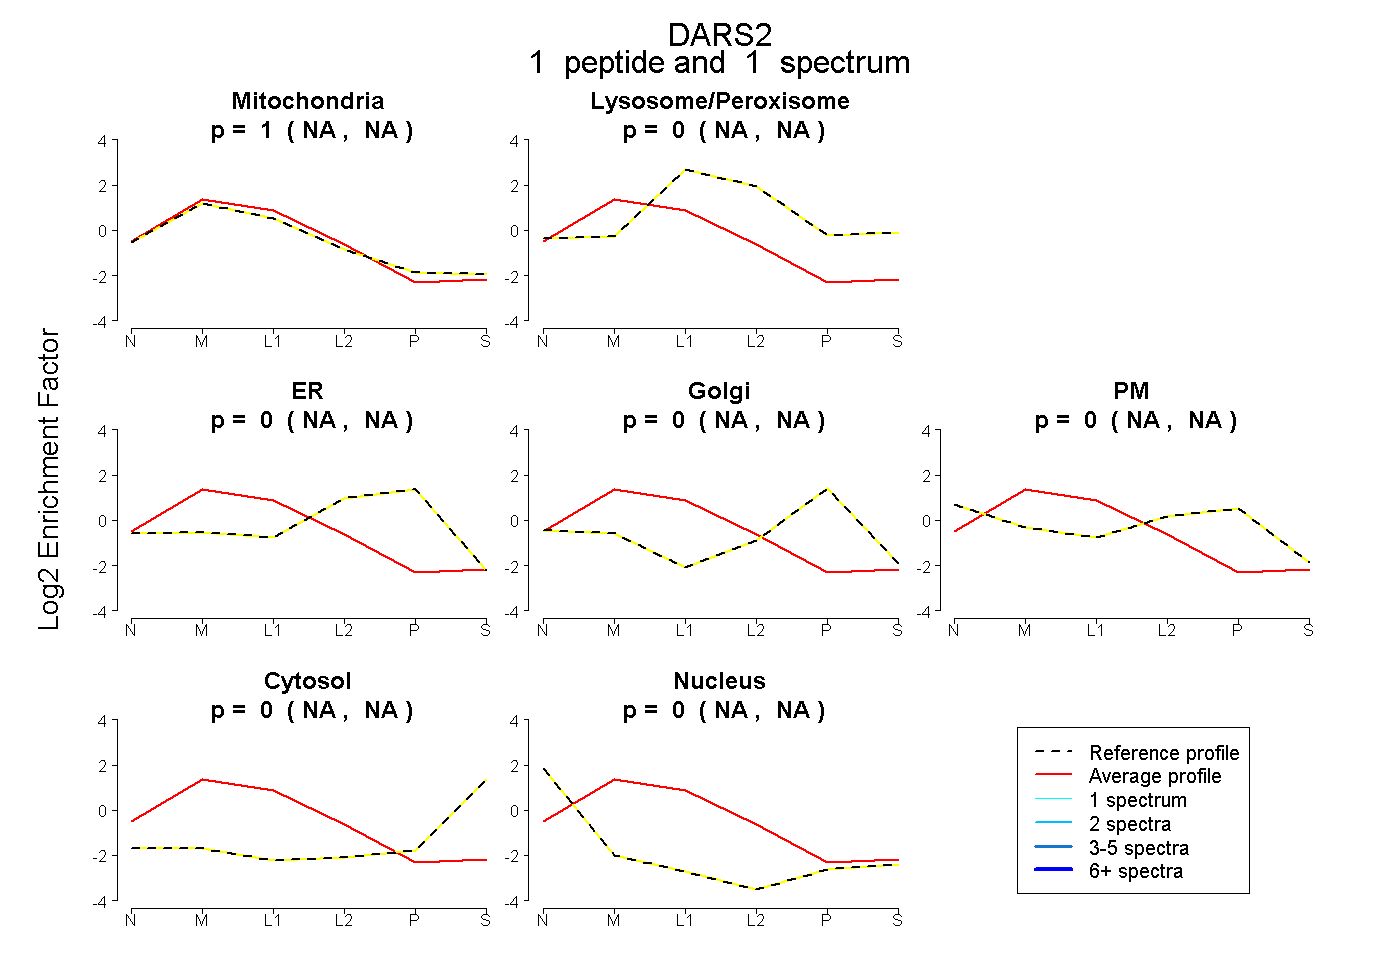 |
1.000 NA | NA |
0.000 NA | NA |
0.000 NA | NA |
0.000 NA | NA |
0.000 NA | NA |
0.000 NA | NA |
0.000 NA | NA |
|||
| Plot | Lyso | Other | |||||||||||
| Expt C |
21 peptides |
69 spectra |
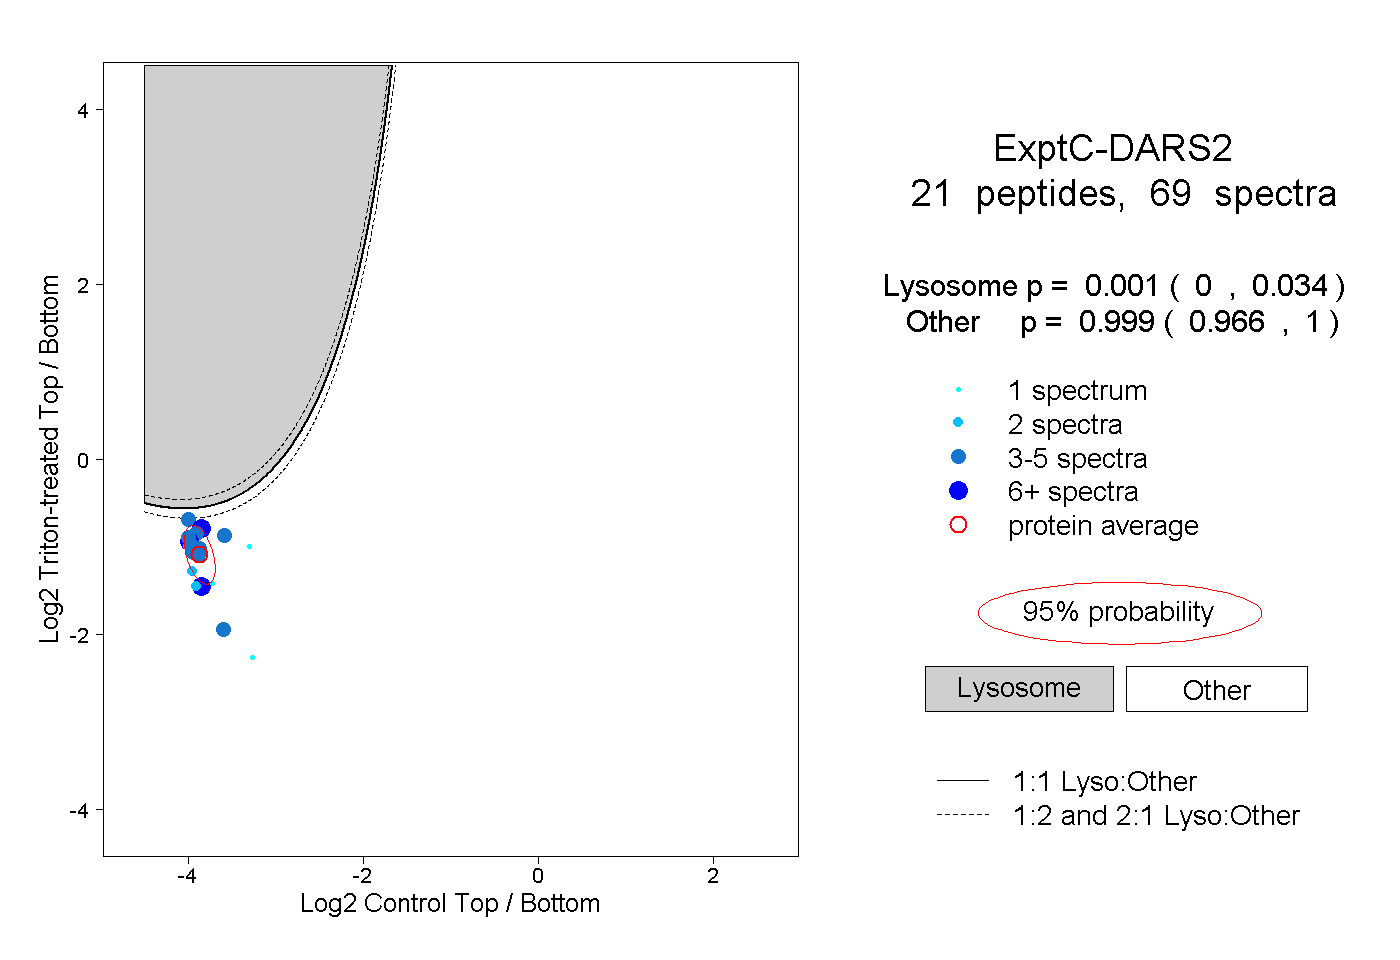 |
0.001 0.000 | 0.034 |
0.999 0.966 | 1.000 |
||||||||
| Plot | Lyso | Other | |||||||||||
| Expt D |
4 peptides |
8 spectra |
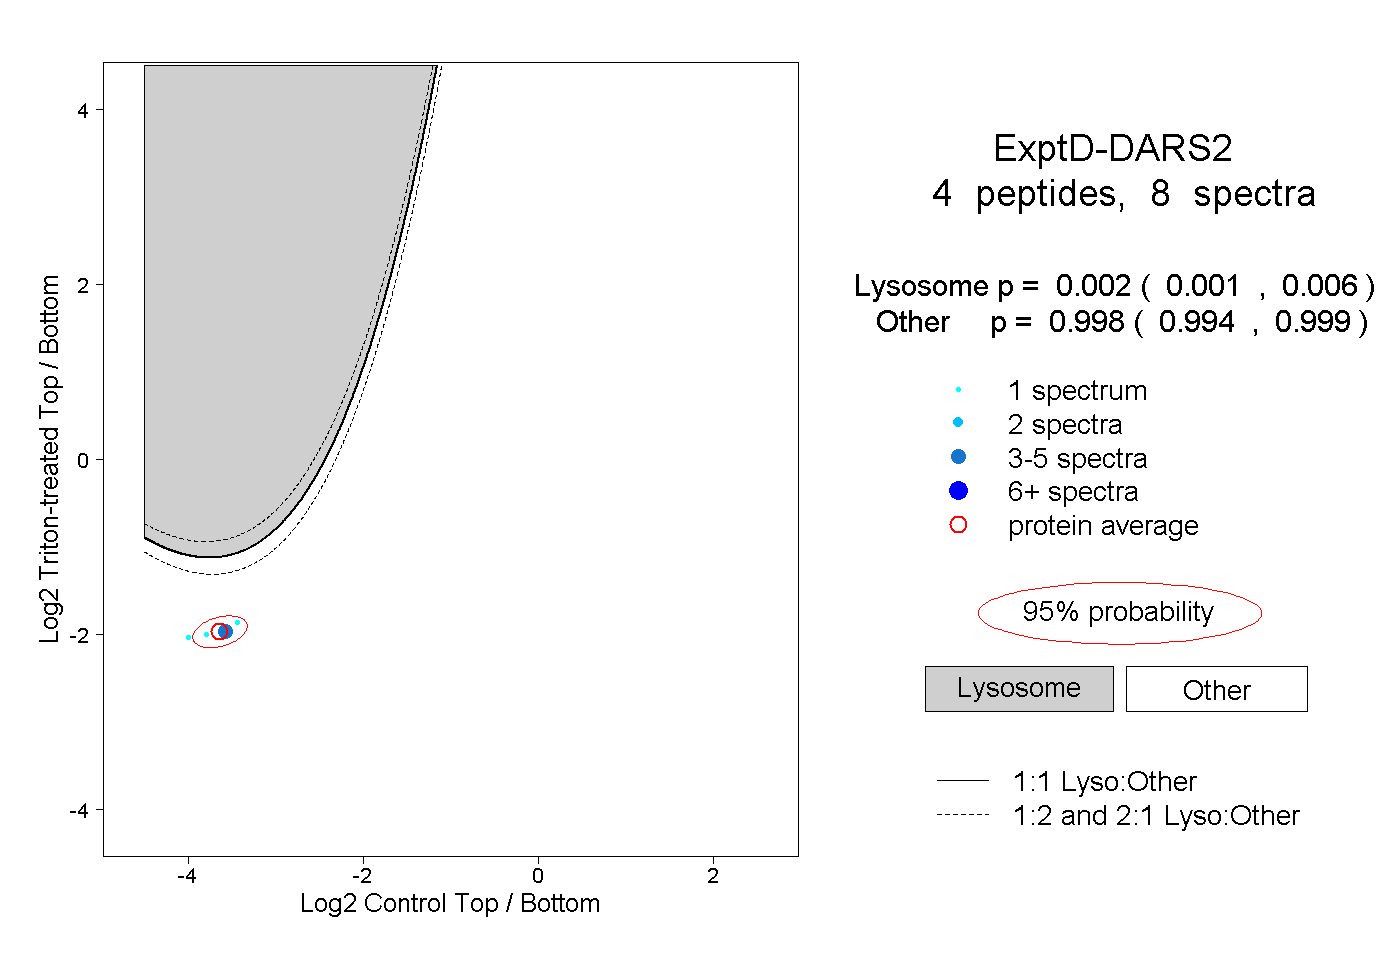 |
0.002 0.001 | 0.006 |
0.998 0.994 | 0.999 |