 8
8peptides
spectra
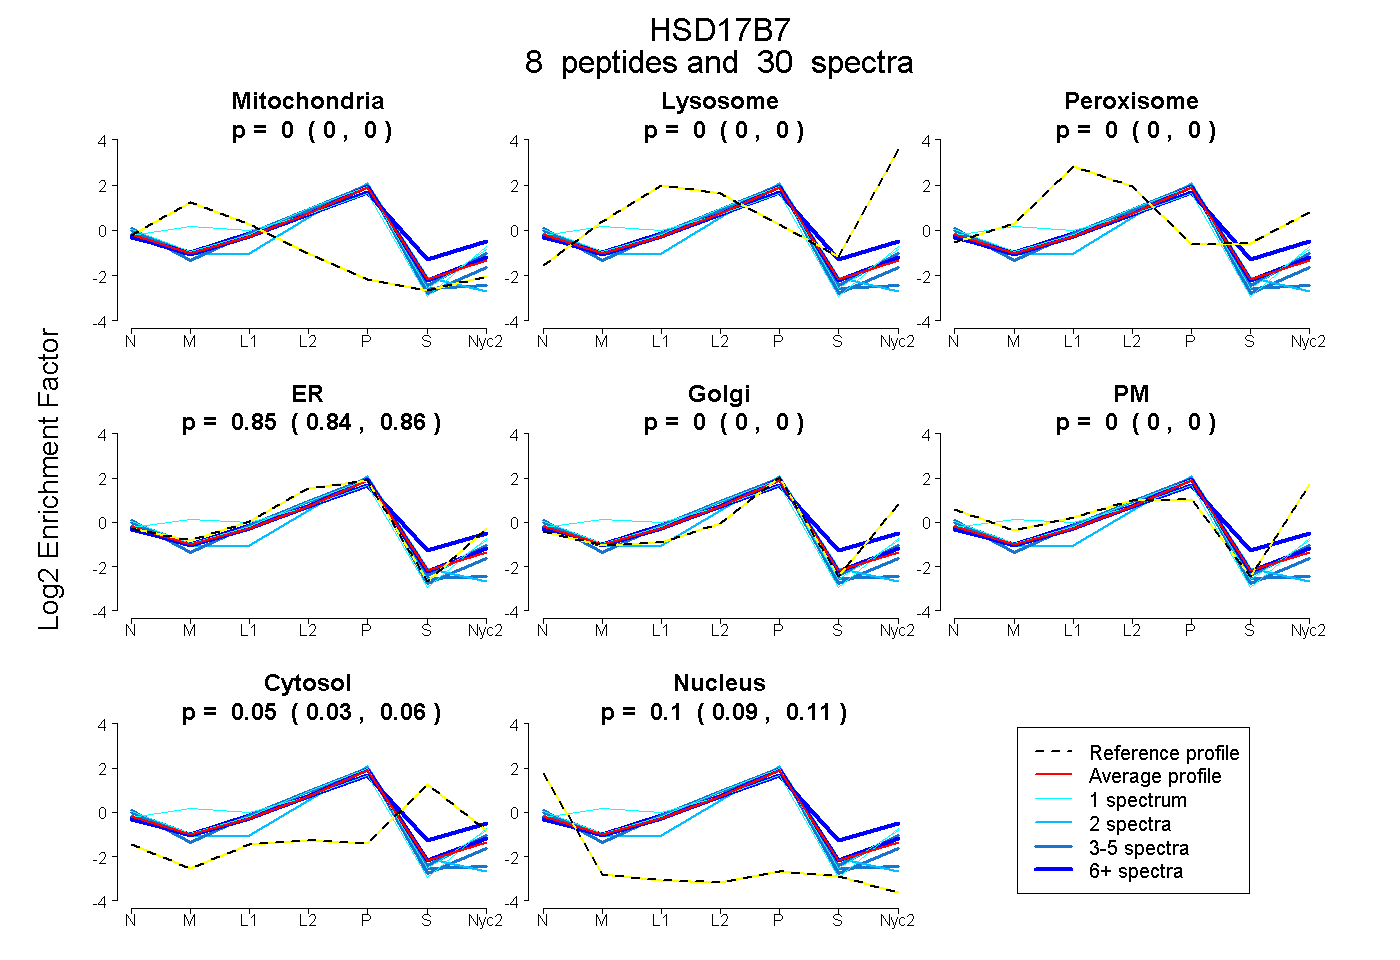
0.000 | 0.000
0.000 | 0.000
0.000 | 0.000
0.841 | 0.857
0.000 | 0.000
0.000 | 0.000
0.035 | 0.064
0.089 | 0.109
6peptides
spectra
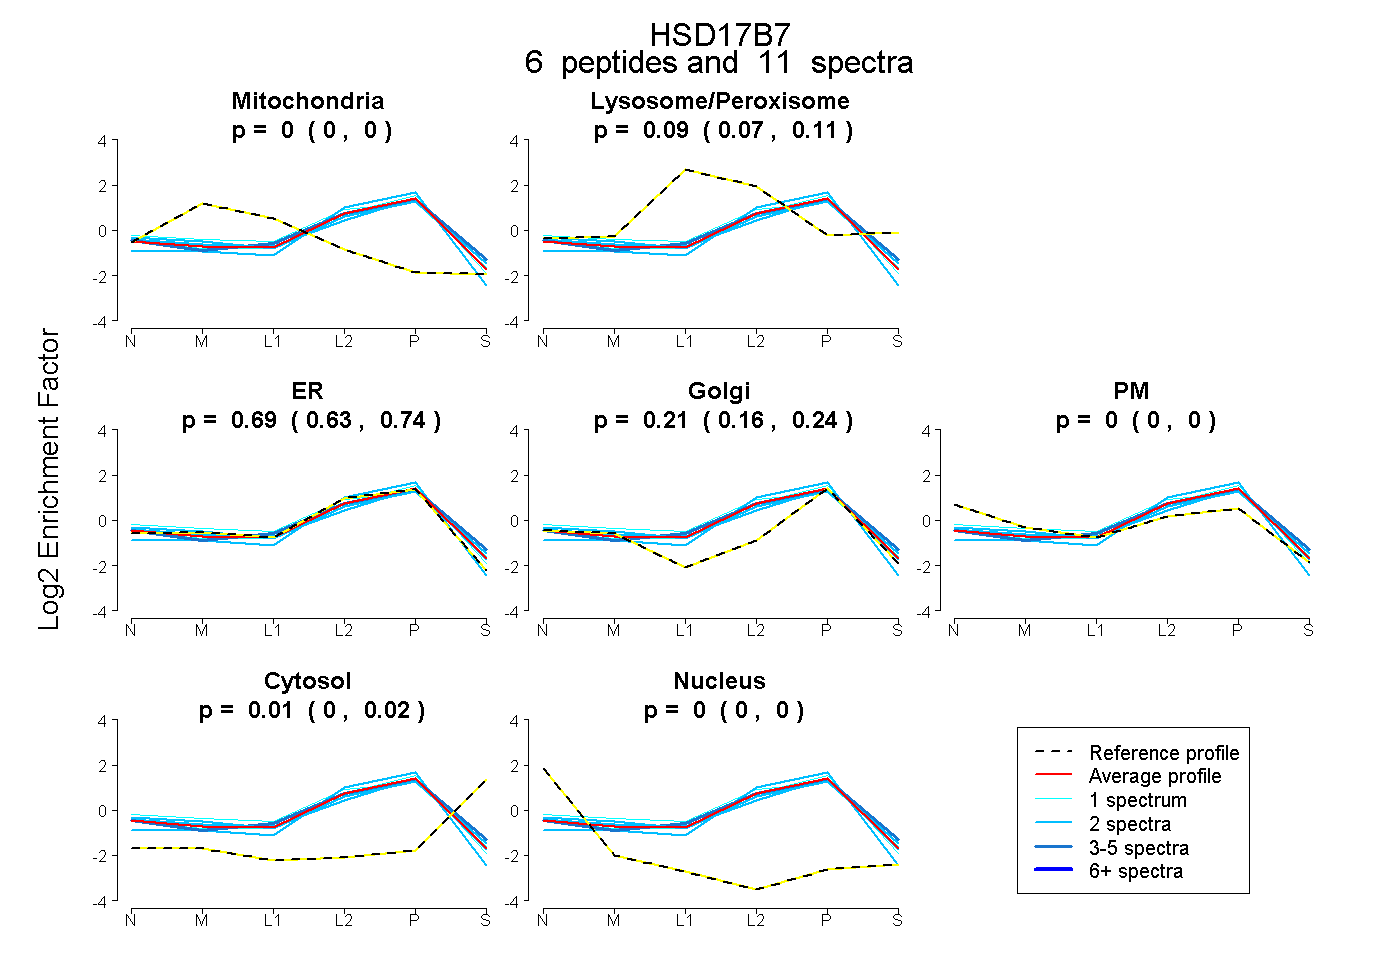
0.000 | 0.000
0.068 | 0.112
0.633 | 0.739
0.160 | 0.244
0.000 | 0.000
0.000 | 0.024
0.000 | 0.000
7peptides
spectra
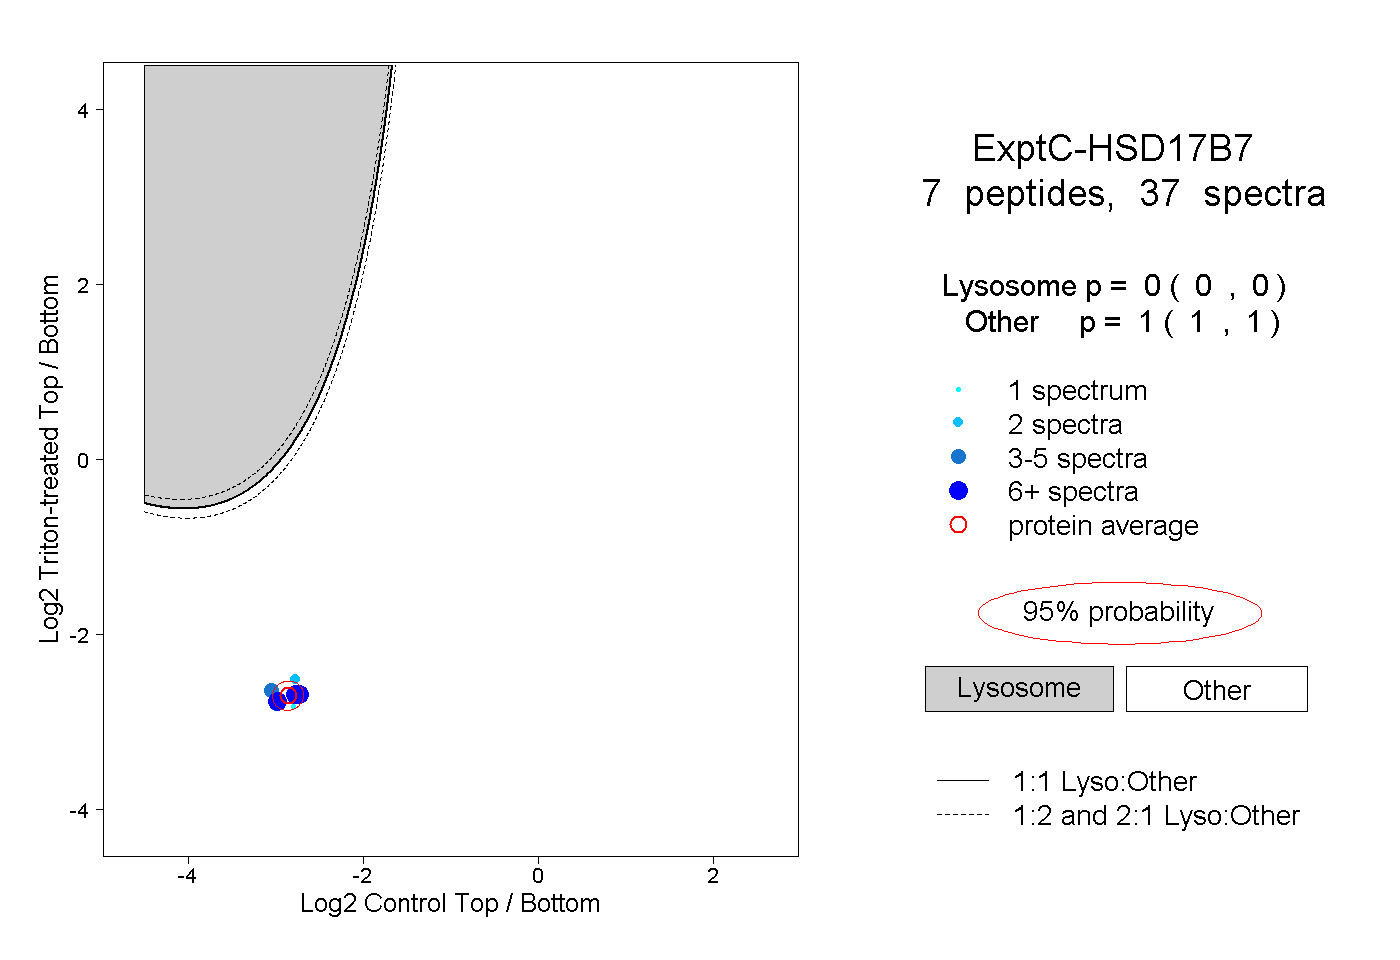
0.000 | 0.000
1.000 | 1.000