 2
2peptides
spectra
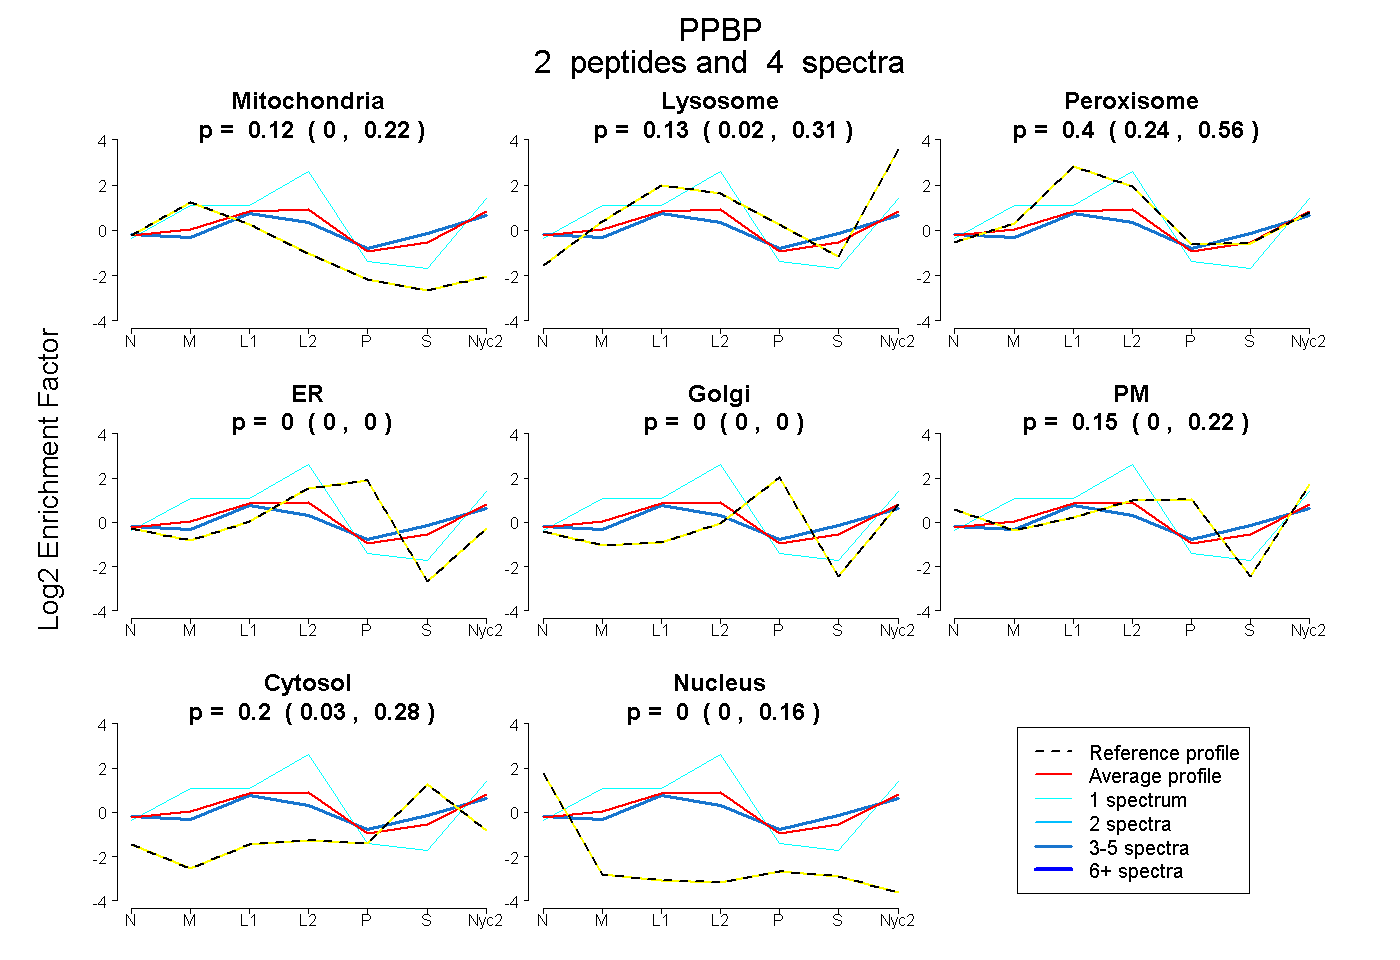
0.000 | 0.222
0.023 | 0.315
0.240 | 0.555
0.000 | 0.000
0.000 | 0.000
0.000 | 0.220
0.033 | 0.277
0.000 | 0.162
| Plot | Mito | Lyso | Perox | ER | Golgi | PM | Cytosol | Nucleus | |||||
| Expt A |
2 peptides |
4 spectra |
|
0.123 0.000 | 0.222 |
0.131 0.023 | 0.315 |
0.399 0.240 | 0.555 |
0.000 0.000 | 0.000 |
0.000 0.000 | 0.000 |
0.146 0.000 | 0.220 |
0.198 0.033 | 0.277 |
0.003 0.000 | 0.162 |
| 1 spectrum, CTNTLSGIPLNSISR | 0.195 | 0.309 | 0.411 | 0.000 | 0.000 | 0.085 | 0.000 | 0.000 | ||
| 3 spectra, EVCLDPTAPMIK | 0.079 | 0.066 | 0.386 | 0.000 | 0.000 | 0.160 | 0.309 | 0.000 |
| Plot | Lyso | Other | |||||||||||
| Expt C |
2 peptides |
3 spectra |
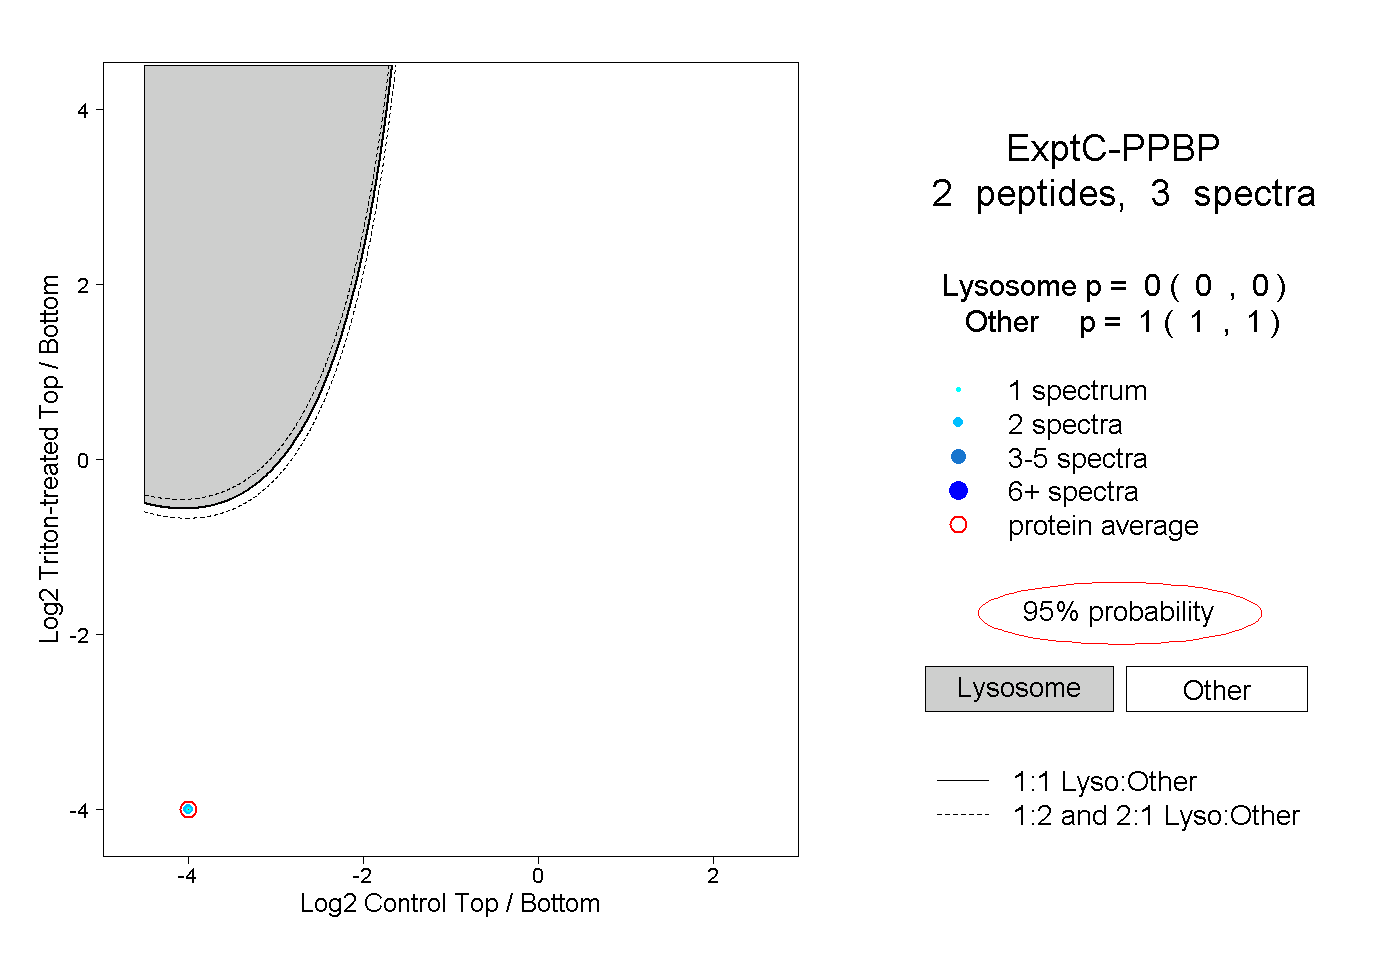 |
0.000 0.000 | 0.000 |
1.000 1.000 | 1.000 |