 5
5peptides
spectra
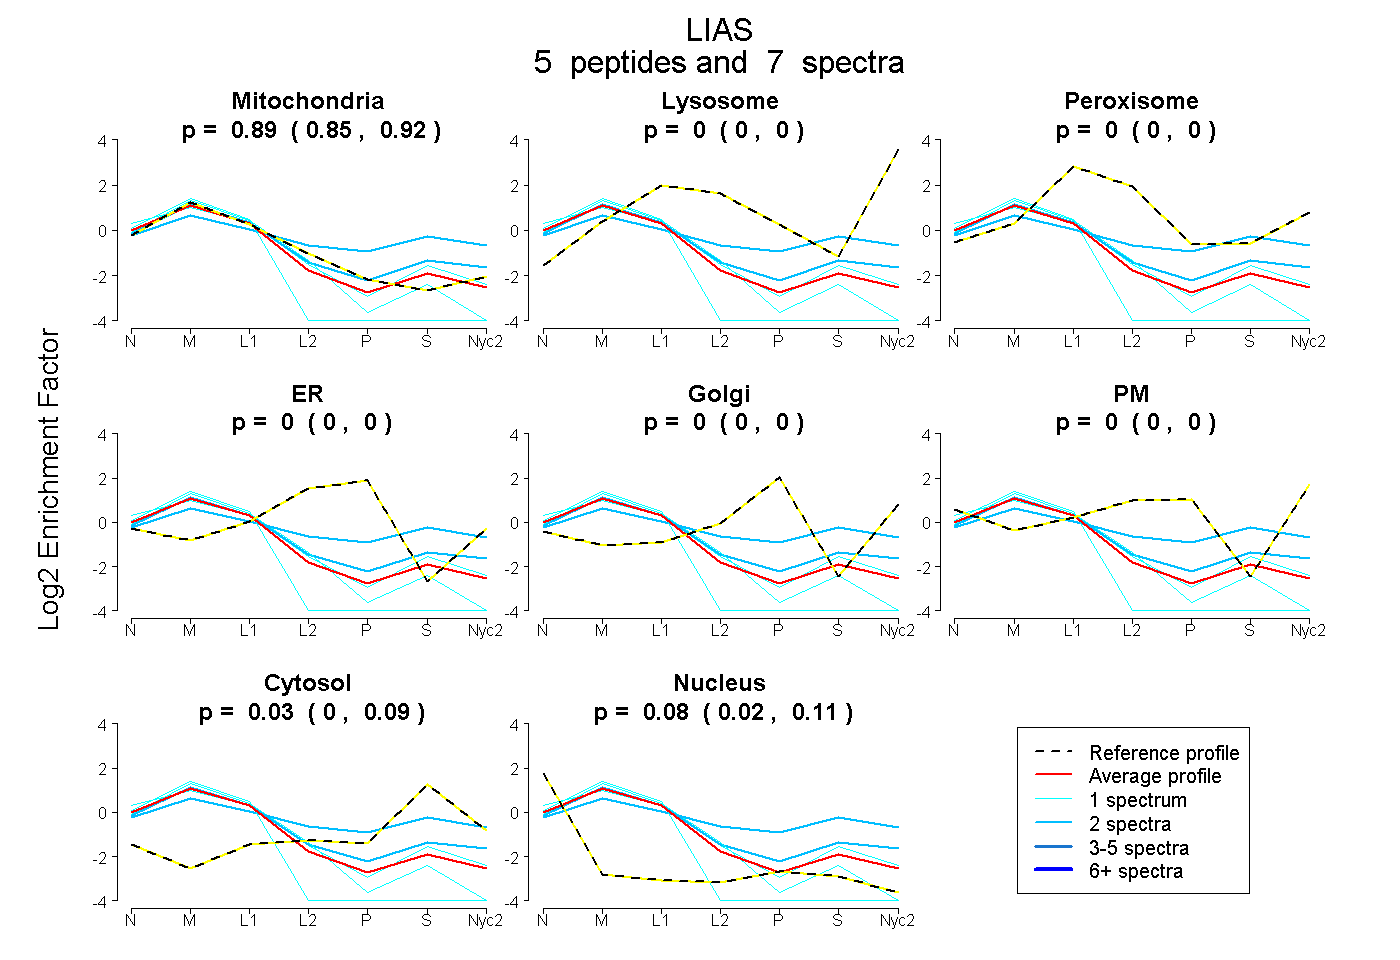
0.852 | 0.921
0.000 | 0.000
0.000 | 0.000
0.000 | 0.000
0.000 | 0.000
0.000 | 0.000
0.000 | 0.089
0.022 | 0.114
| Plot | Mito | Lyso | Perox | ER | Golgi | PM | Cytosol | Nucleus | |||||
| Expt A |
5 peptides |
7 spectra |
|
0.893 0.852 | 0.921 |
0.000 0.000 | 0.000 |
0.000 0.000 | 0.000 |
0.000 0.000 | 0.000 |
0.000 0.000 | 0.000 |
0.000 0.000 | 0.000 |
0.030 0.000 | 0.089 |
0.076 0.022 | 0.114 |
| 1 spectrum, VEEYVTPEK | 0.747 | 0.000 | 0.000 | 0.000 | 0.000 | 0.000 | 0.000 | 0.253 | ||
| 2 spectra, NLNLHTVCEEAR | 0.412 | 0.031 | 0.175 | 0.000 | 0.000 | 0.074 | 0.309 | 0.000 | ||
| 1 spectrum, ILVECLTPDFR | 0.898 | 0.000 | 0.000 | 0.000 | 0.000 | 0.000 | 0.000 | 0.102 | ||
| 2 spectra, ANFDQSLR | 0.815 | 0.000 | 0.033 | 0.000 | 0.000 | 0.000 | 0.152 | 0.000 | ||
| 1 spectrum, AGEFFLK | 0.865 | 0.000 | 0.000 | 0.000 | 0.000 | 0.000 | 0.070 | 0.065 |
| Plot | Mito | Lyso or Perox | ER | Golgi | PM | Cytosol | Nucleus | ||||||
| Expt B |
1 peptide |
2 spectra |
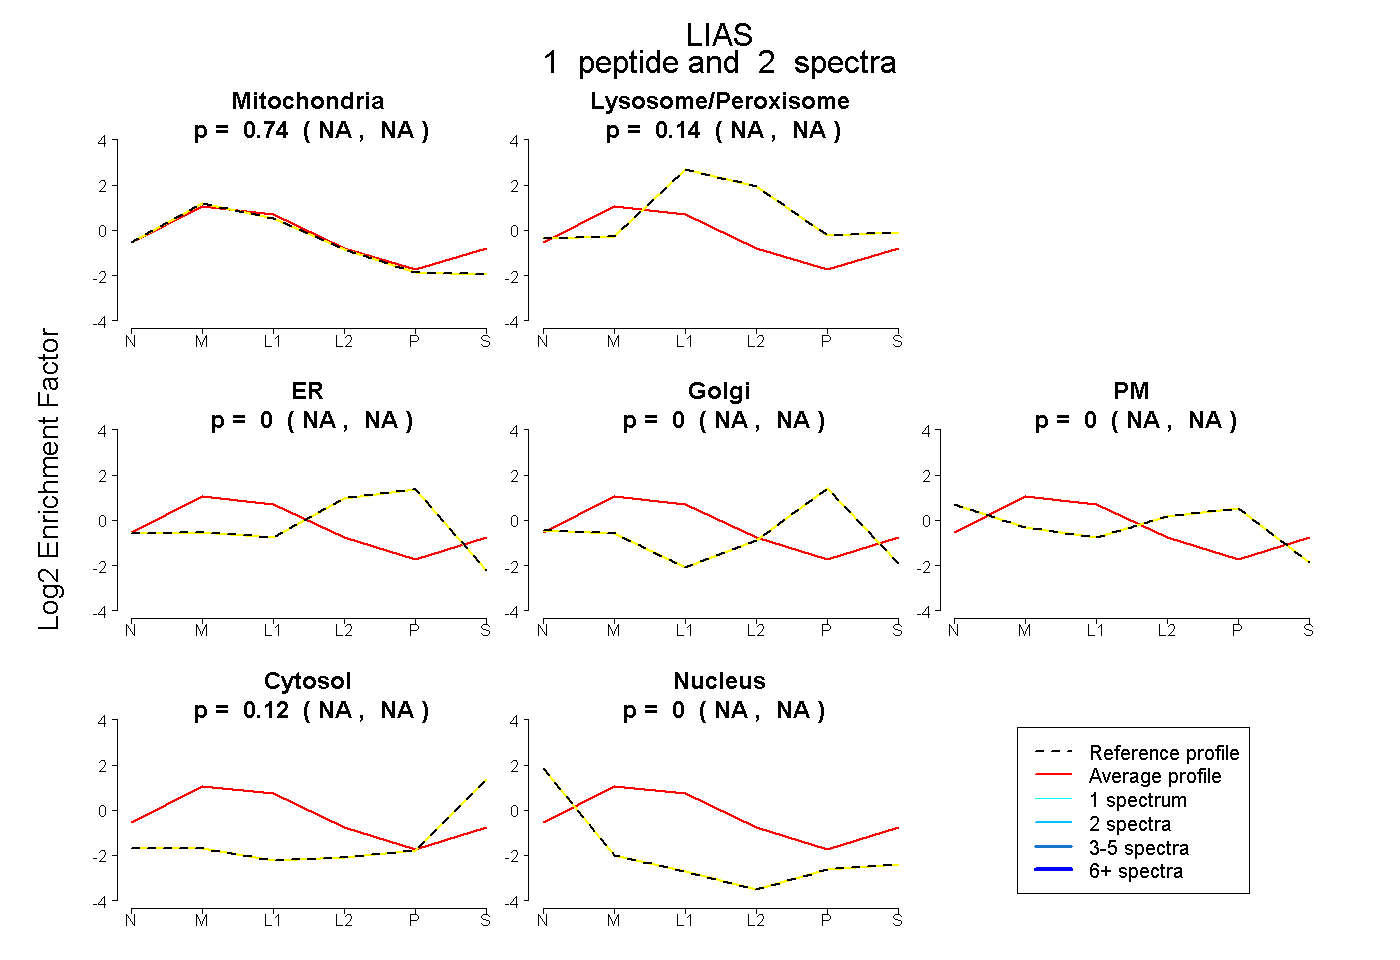 |
0.737 NA | NA |
0.143 NA | NA |
0.000 NA | NA |
0.000 NA | NA |
0.000 NA | NA |
0.120 NA | NA |
0.000 NA | NA |
|||
| Plot | Lyso | Other | |||||||||||
| Expt C |
10 peptides |
31 spectra |
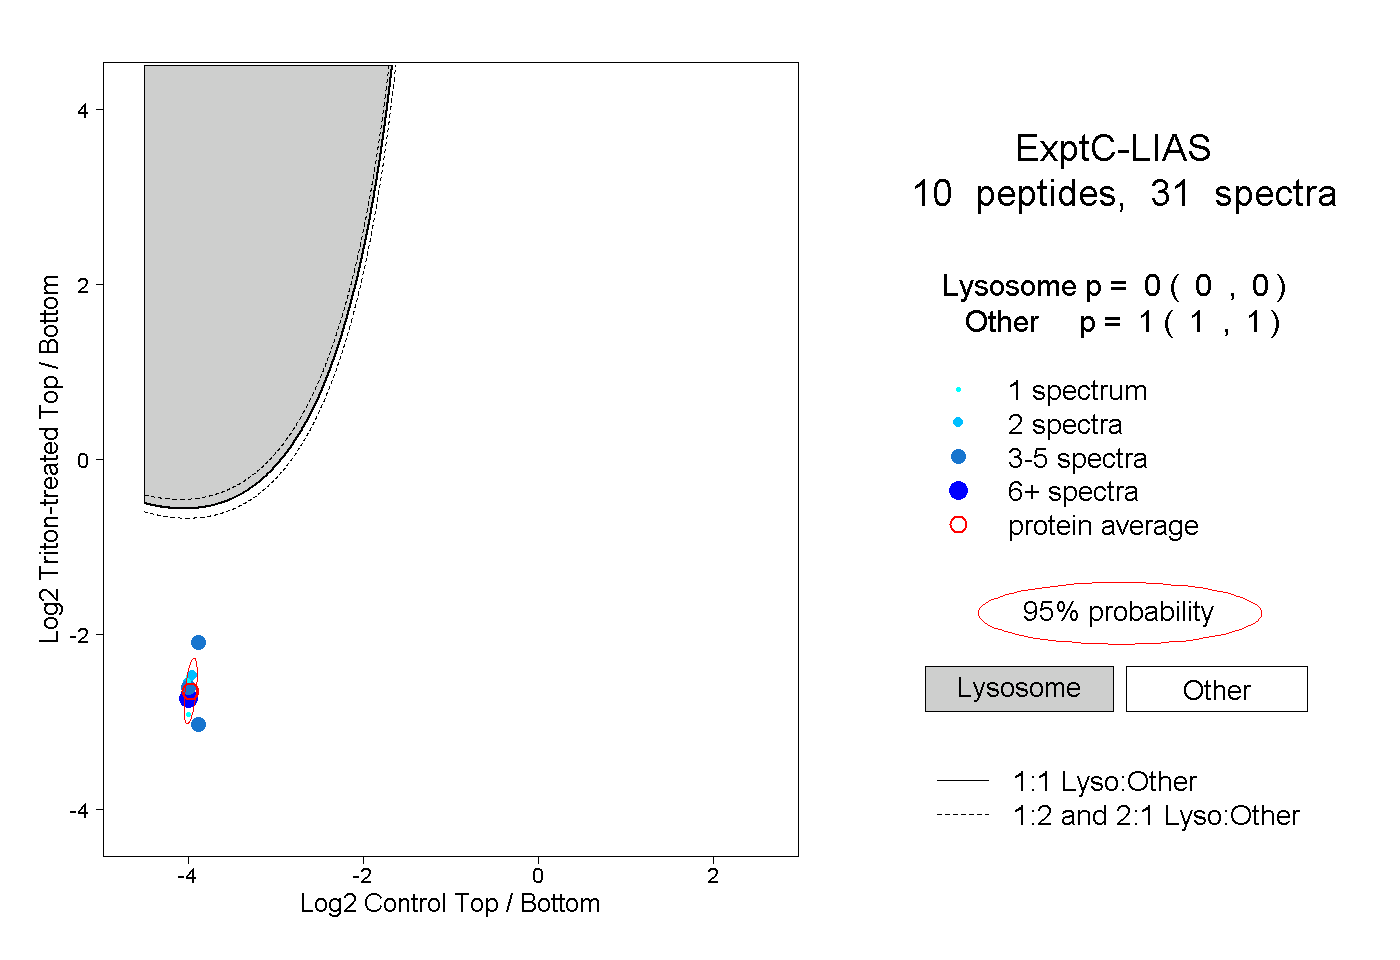 |
0.000 0.000 | 0.000 |
1.000 1.000 | 1.000 |
||||||||
| Plot | Lyso | Other | |||||||||||
| Expt D |
3 peptides |
5 spectra |
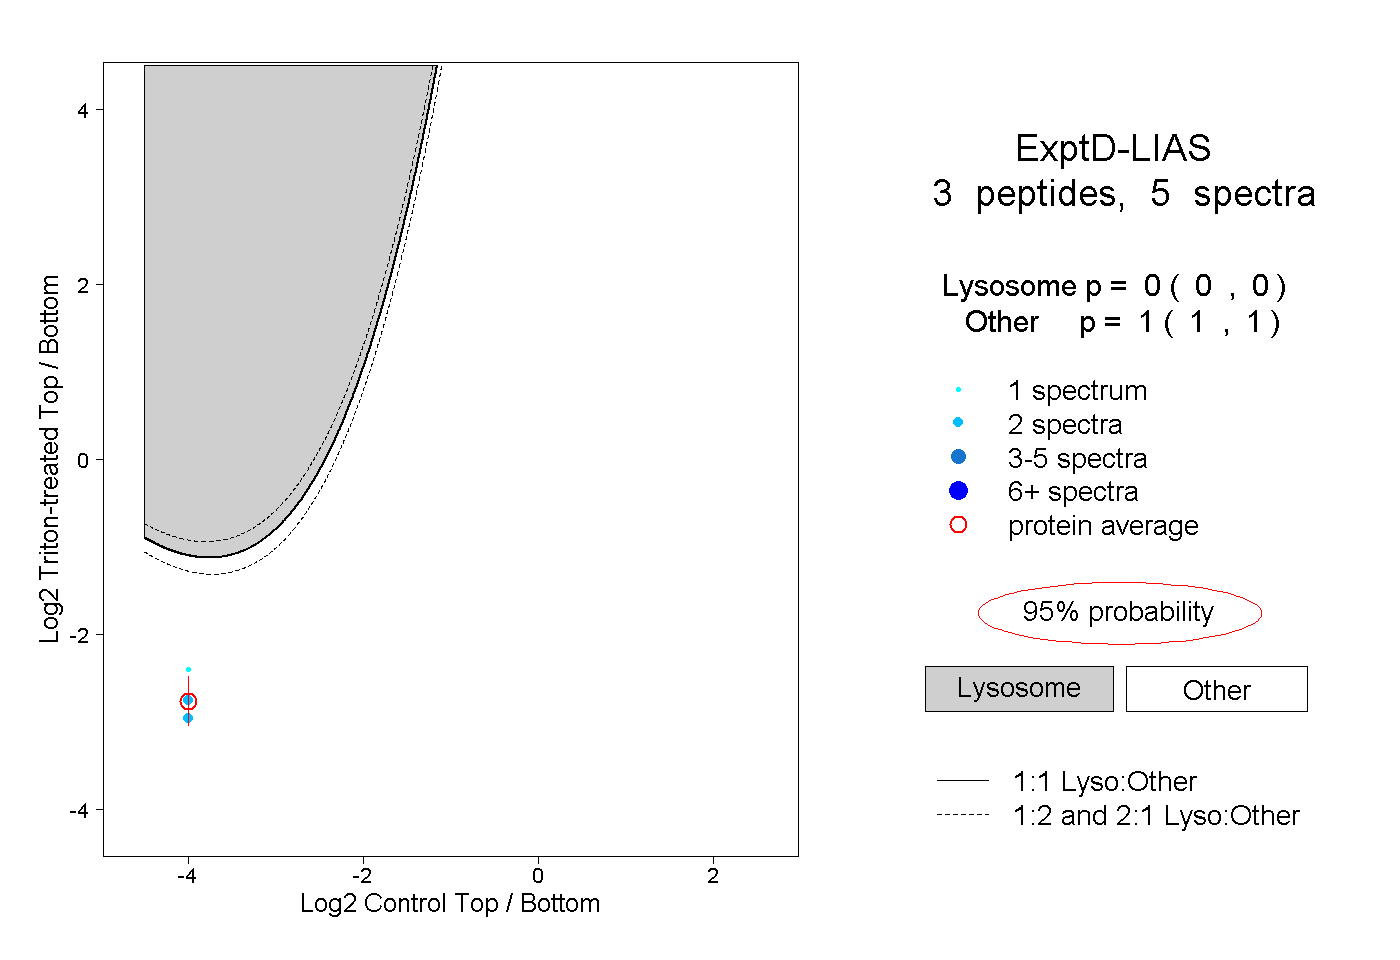 |
0.000 0.000 | 0.000 |
1.000 1.000 | 1.000 |