22
22peptides
spectra
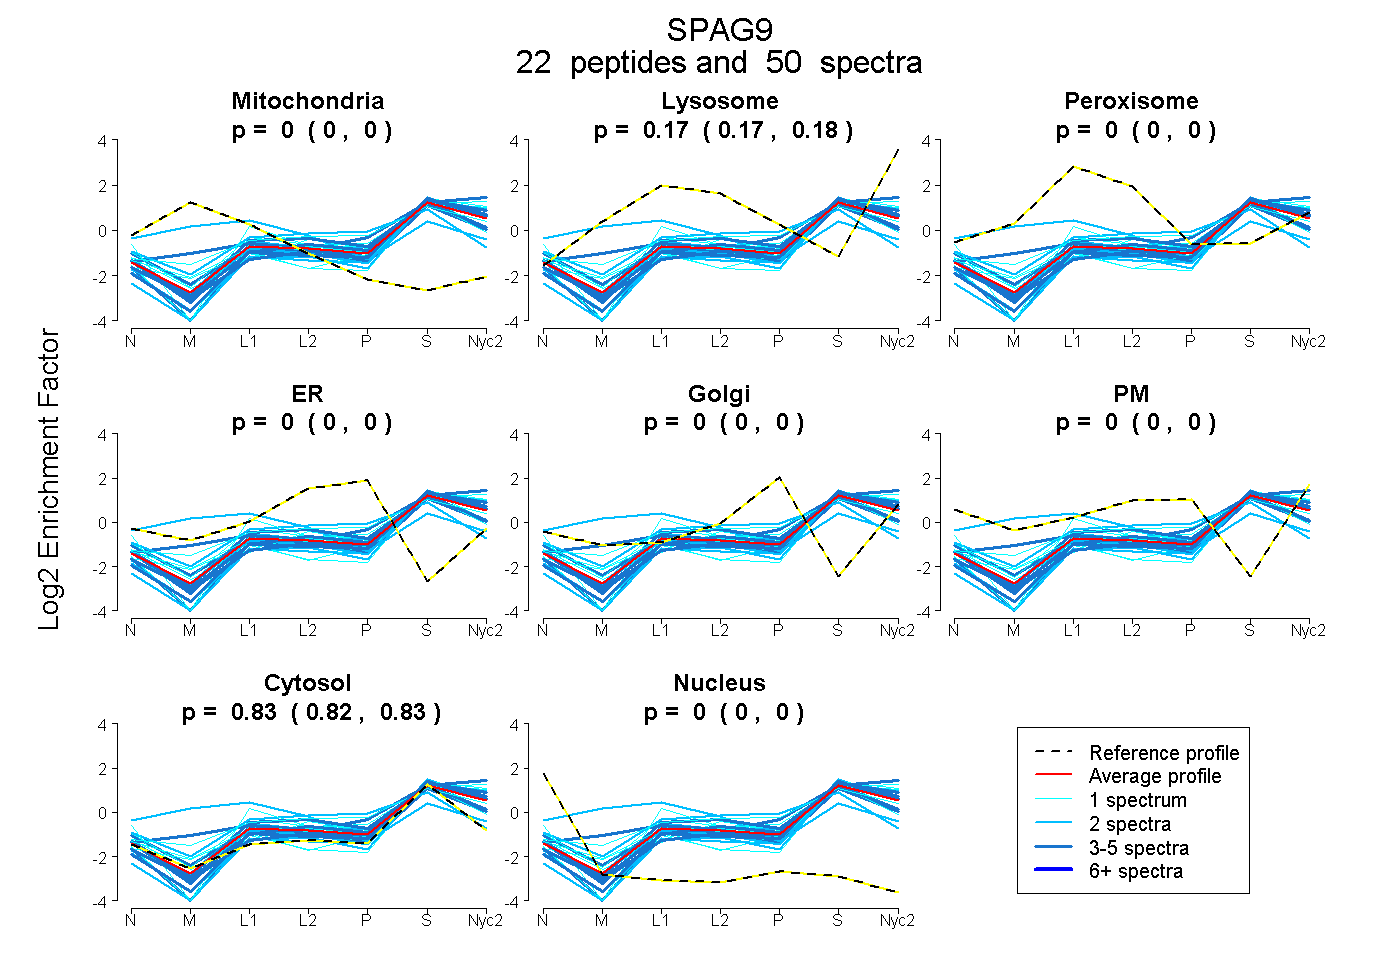
0.000 | 0.000
0.170 | 0.178
0.000 | 0.000
0.000 | 0.000
0.000 | 0.000
0.000 | 0.000
0.821 | 0.829
0.000 | 0.000
4peptides
spectra
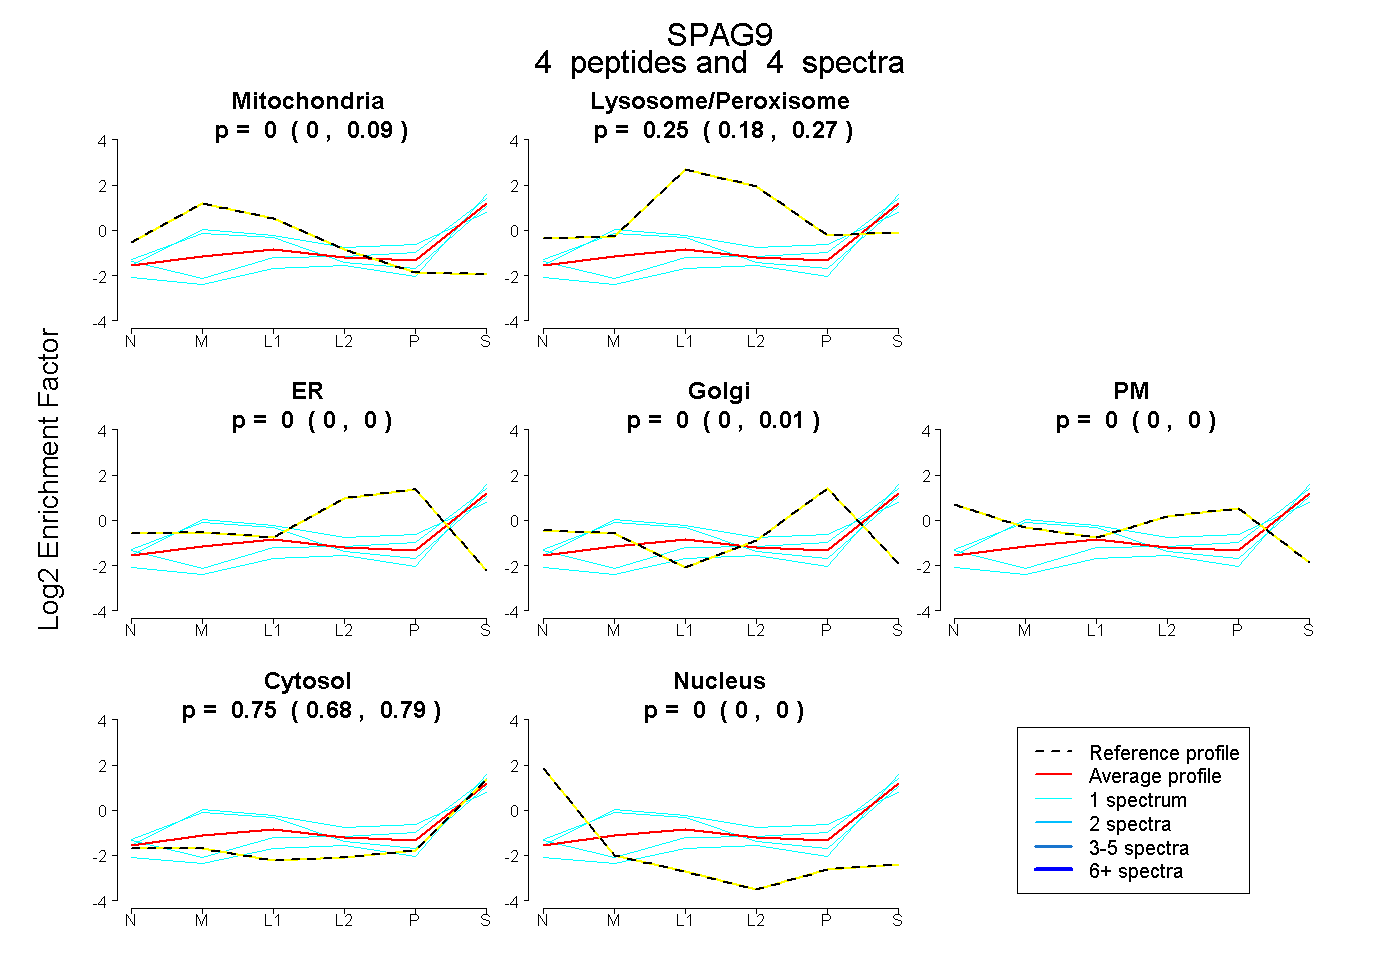
0.000 | 0.091
0.181 | 0.275
0.000 | 0.000
0.000 | 0.008
0.000 | 0.000
0.681 | 0.788
0.000 | 0.000