 22
22peptides
spectra
0.000 | 0.000
0.170 | 0.178
0.000 | 0.000
0.000 | 0.000
0.000 | 0.000
0.000 | 0.000
0.821 | 0.829
0.000 | 0.000
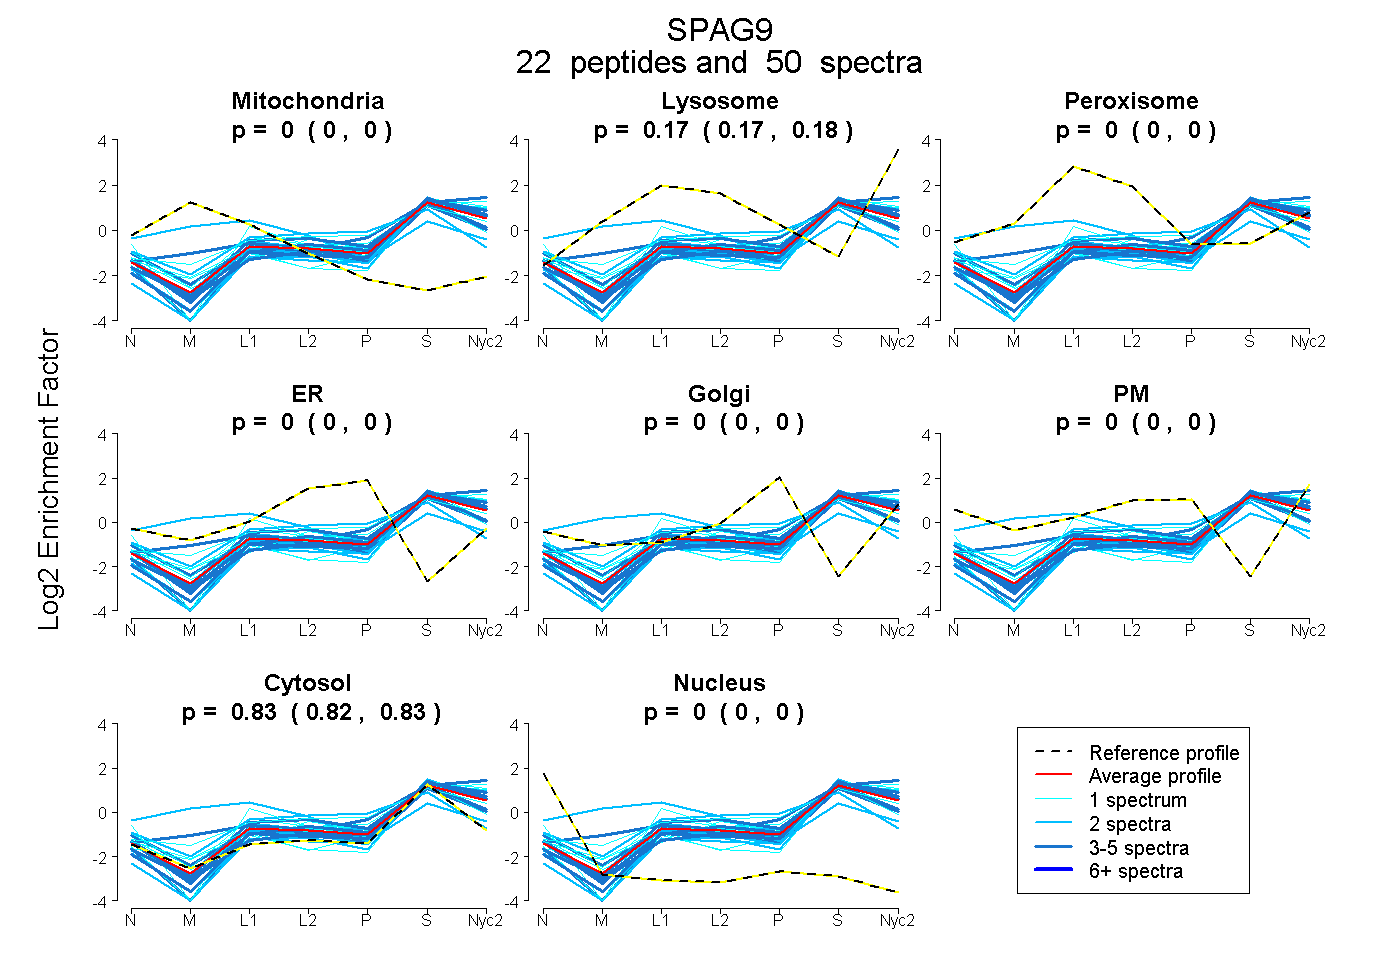
| Plot | Mito | Lyso | Perox | ER | Golgi | PM | Cytosol | Nucleus | |||||
| Expt A |
22 peptides |
50 spectra |
|
0.000 0.000 | 0.000 |
0.174 0.170 | 0.178 |
0.000 0.000 | 0.000 |
0.000 0.000 | 0.000 |
0.000 0.000 | 0.000 |
0.000 0.000 | 0.000 |
0.826 0.821 | 0.829 |
0.000 0.000 | 0.000 |
| 1 spectrum, EYNALHQR | 0.000 | 0.211 | 0.000 | 0.000 | 0.000 | 0.000 | 0.789 | 0.000 | ||
| 2 spectra, DDNEQLITQYER | 0.000 | 0.039 | 0.000 | 0.000 | 0.000 | 0.000 | 0.961 | 0.000 | ||
| 1 spectrum, VQAFGWSLPQK | 0.000 | 0.216 | 0.000 | 0.000 | 0.000 | 0.000 | 0.784 | 0.000 | ||
| 3 spectra, VDELTCEK | 0.000 | 0.081 | 0.000 | 0.000 | 0.007 | 0.000 | 0.912 | 0.000 | ||
| 1 spectrum, SSTLSQLPGDK | 0.000 | 0.238 | 0.000 | 0.000 | 0.000 | 0.000 | 0.762 | 0.000 | ||
| 1 spectrum, VWCGYR | 0.000 | 0.249 | 0.031 | 0.000 | 0.047 | 0.000 | 0.672 | 0.000 | ||
| 5 spectra, TSGTPGNRPGSVIR | 0.000 | 0.287 | 0.000 | 0.000 | 0.000 | 0.000 | 0.713 | 0.000 | ||
| 3 spectra, ITALMVSCNR | 0.068 | 0.167 | 0.047 | 0.000 | 0.000 | 0.000 | 0.719 | 0.000 | ||
| 5 spectra, DVSALESEGSK | 0.000 | 0.186 | 0.000 | 0.000 | 0.000 | 0.000 | 0.814 | 0.000 | ||
| 4 spectra, ENPAMQEK | 0.000 | 0.161 | 0.000 | 0.000 | 0.035 | 0.000 | 0.804 | 0.000 | ||
| 1 spectrum, KPEPPVNLK | 0.000 | 0.271 | 0.000 | 0.000 | 0.000 | 0.000 | 0.729 | 0.000 | ||
| 1 spectrum, AGSSAQEPSSQTPLK | 0.000 | 0.000 | 0.000 | 0.000 | 0.000 | 0.000 | 1.000 | 0.000 | ||
| 1 spectrum, LFSSSSNAAK | 0.000 | 0.092 | 0.000 | 0.000 | 0.000 | 0.000 | 0.908 | 0.000 | ||
| 1 spectrum, EVENLILENTQLLETK | 0.000 | 0.135 | 0.000 | 0.000 | 0.000 | 0.000 | 0.865 | 0.000 | ||
| 2 spectra, GGETPGSEQWK | 0.000 | 0.197 | 0.000 | 0.000 | 0.000 | 0.000 | 0.803 | 0.000 | ||
| 4 spectra, YDEEVVK | 0.000 | 0.095 | 0.000 | 0.000 | 0.000 | 0.000 | 0.905 | 0.000 | ||
| 2 spectra, LWCAVGVNLSGGK | 0.000 | 0.000 | 0.146 | 0.188 | 0.000 | 0.000 | 0.666 | 0.000 | ||
| 3 spectra, AFDFLSEETEASLASR | 0.000 | 0.090 | 0.000 | 0.000 | 0.000 | 0.000 | 0.910 | 0.000 | ||
| 3 spectra, VYGDENSDK | 0.000 | 0.184 | 0.000 | 0.000 | 0.000 | 0.000 | 0.816 | 0.000 | ||
| 2 spectra, LMELQEAVR | 0.000 | 0.166 | 0.000 | 0.000 | 0.000 | 0.000 | 0.834 | 0.000 | ||
| 2 spectra, SHLIVWQVMCGNE | 0.235 | 0.000 | 0.379 | 0.000 | 0.000 | 0.000 | 0.386 | 0.000 | ||
| 2 spectra, LGFSFVR | 0.000 | 0.058 | 0.000 | 0.000 | 0.000 | 0.000 | 0.942 | 0.000 |
| Plot | Mito | Lyso or Perox | ER | Golgi | PM | Cytosol | Nucleus | ||||||
| Expt B |
4 peptides |
4 spectra |
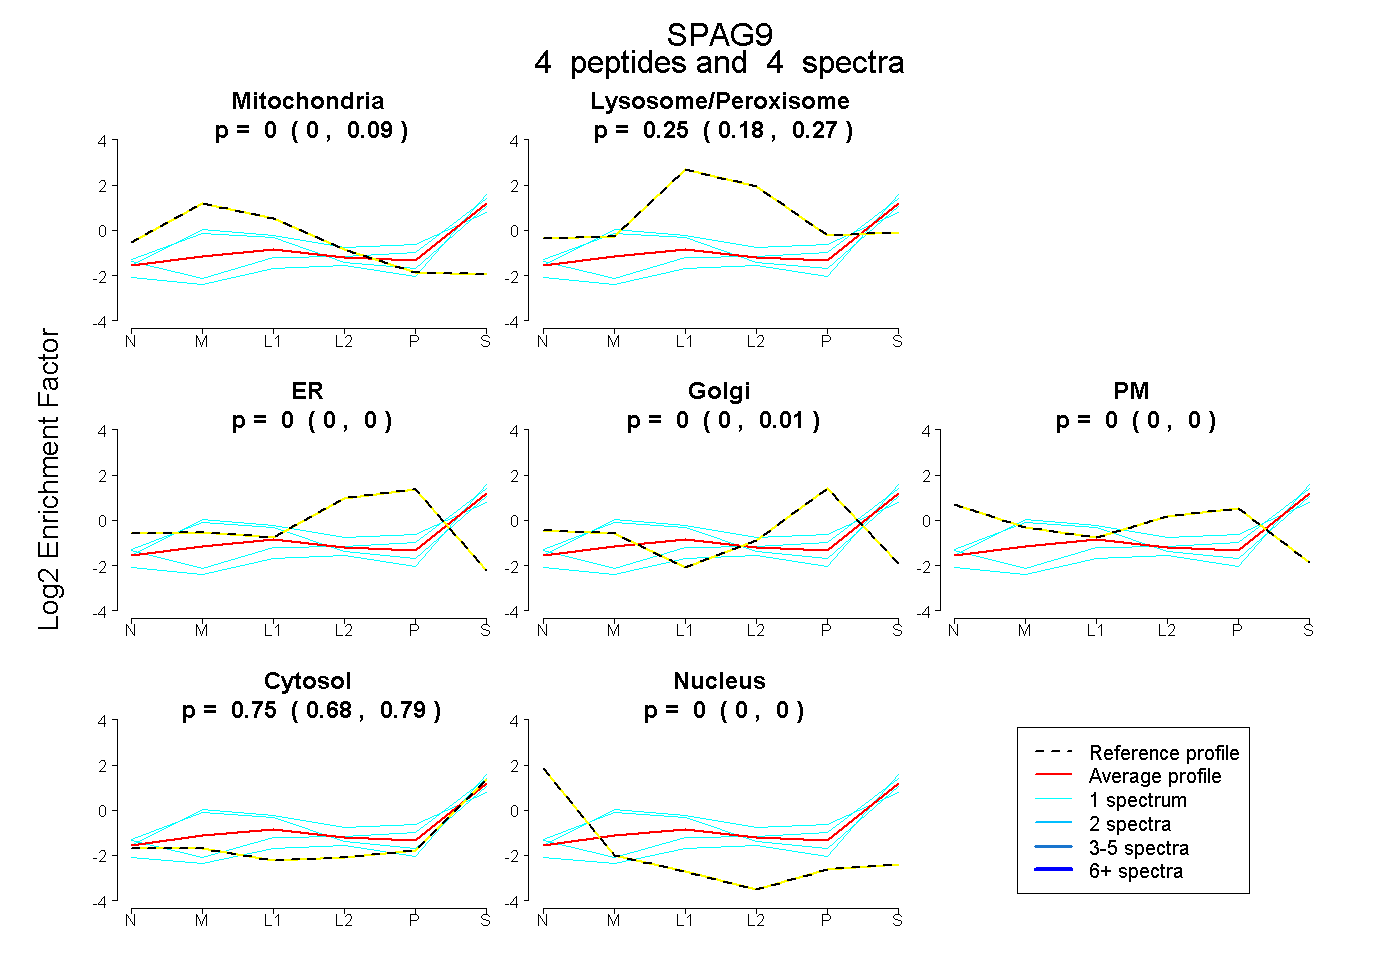 |
0.000 0.000 | 0.091 |
0.247 0.181 | 0.275 |
0.000 0.000 | 0.000 |
0.000 0.000 | 0.008 |
0.000 0.000 | 0.000 |
0.753 0.681 | 0.788 |
0.000 0.000 | 0.000 |
|||
| Plot | Lyso | Other | |||||||||||
| Expt C |
23 peptides |
69 spectra |
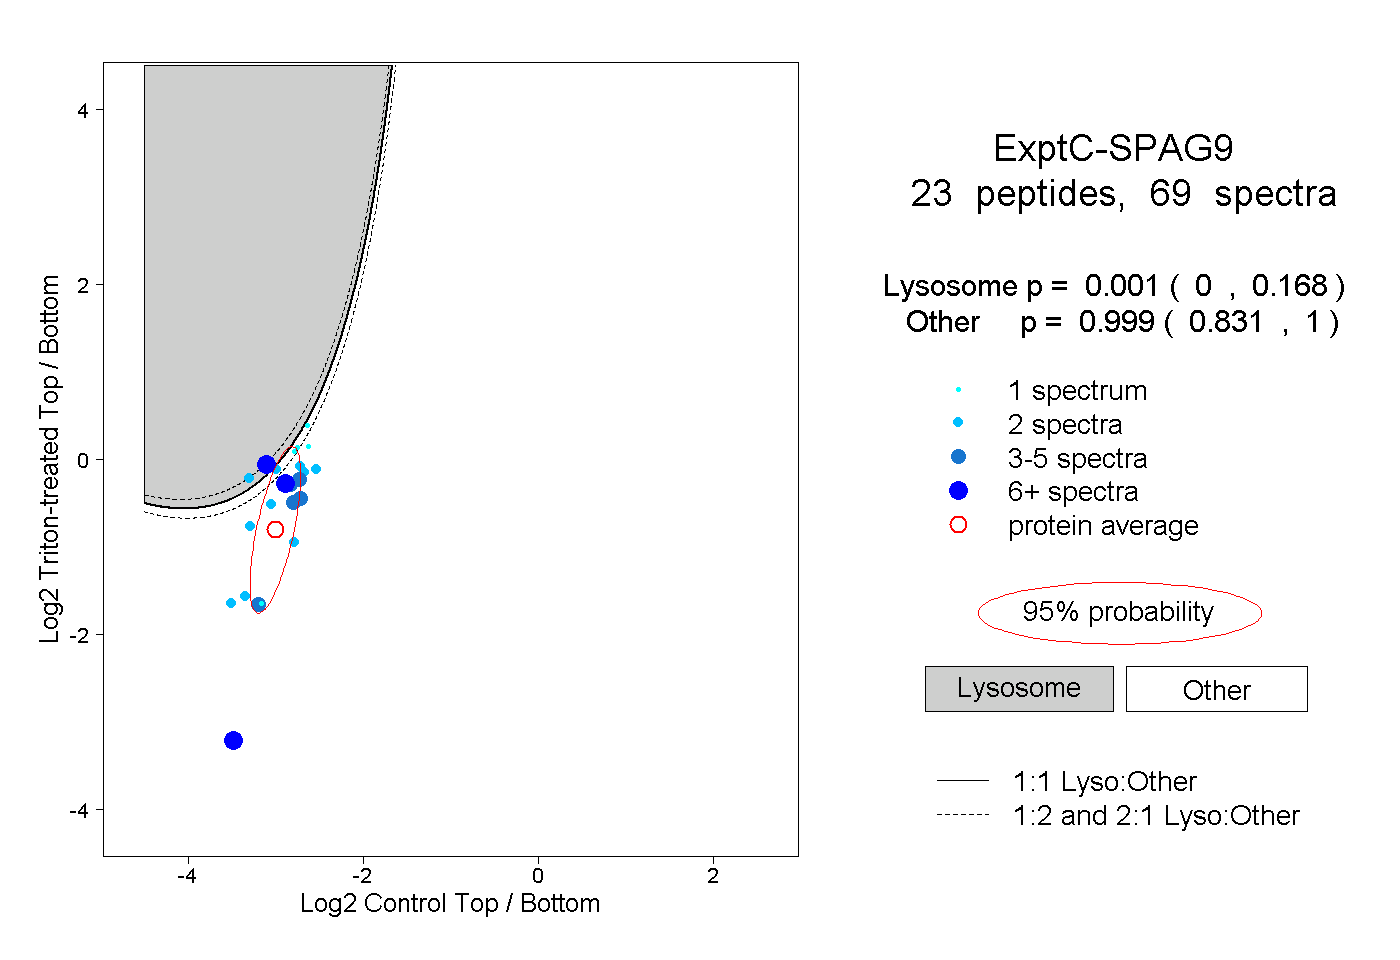 |
0.001 0.000 | 0.168 |
0.999 0.831 | 1.000 |
||||||||
| Plot | Lyso | Other | |||||||||||
| Expt D |
1 peptide |
1 spectrum |
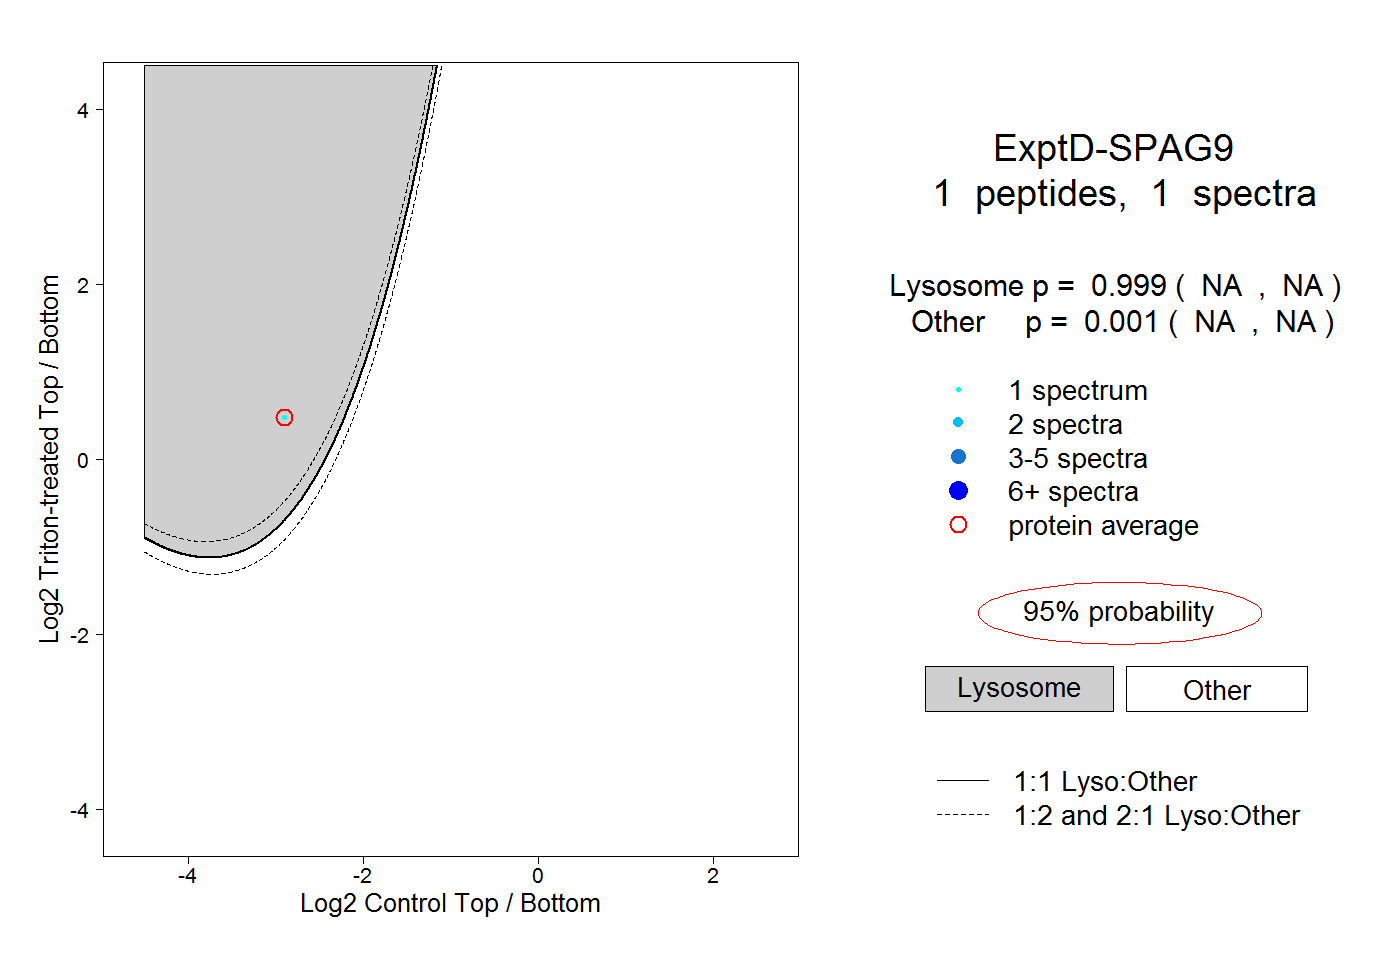 |
0.999 NA | NA |
0.001 NA | NA |