 6
6peptides
spectra
0.000 | 0.000
0.000 | 0.000
0.000 | 0.000
0.687 | 0.754
0.148 | 0.221
0.004 | 0.063
0.000 | 0.002
0.043 | 0.062
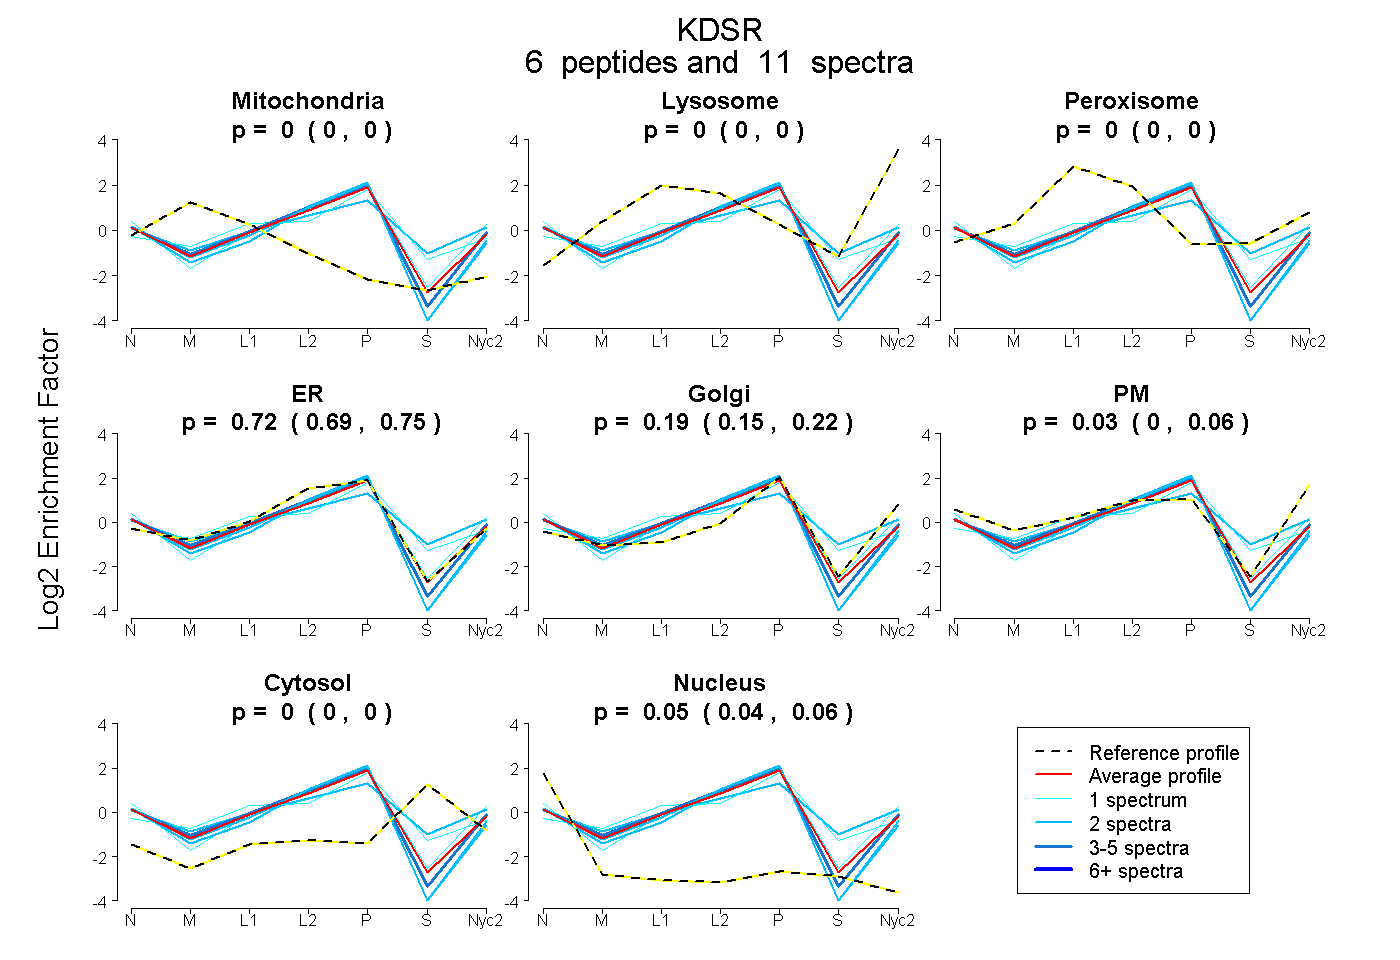
| Plot | Mito | Lyso | Perox | ER | Golgi | PM | Cytosol | Nucleus | |||||
| Expt A |
6 peptides |
11 spectra |
|
0.000 0.000 | 0.000 |
0.000 0.000 | 0.000 |
0.000 0.000 | 0.000 |
0.723 0.687 | 0.754 |
0.188 0.148 | 0.221 |
0.035 0.004 | 0.063 |
0.000 0.000 | 0.002 |
0.054 0.043 | 0.062 |
| 1 spectrum, AVITTMK | 0.000 | 0.000 | 0.000 | 0.545 | 0.249 | 0.160 | 0.000 | 0.046 | ||
| 1 spectrum, LGPVDMLVNCAGTSK | 0.000 | 0.000 | 0.123 | 0.488 | 0.249 | 0.000 | 0.141 | 0.000 | ||
| 2 spectra, QGAFITLVAR | 0.000 | 0.000 | 0.000 | 0.874 | 0.060 | 0.000 | 0.000 | 0.066 | ||
| 3 spectra, LMSINYLGSVYPSR | 0.000 | 0.000 | 0.000 | 0.773 | 0.138 | 0.054 | 0.000 | 0.036 | ||
| 2 spectra, CIAIECYK | 0.000 | 0.000 | 0.095 | 0.368 | 0.143 | 0.188 | 0.206 | 0.000 | ||
| 2 spectra, FEELEVSSFEK | 0.000 | 0.000 | 0.000 | 0.869 | 0.044 | 0.000 | 0.000 | 0.087 |
| Plot | Mito | Lyso or Perox | ER | Golgi | PM | Cytosol | Nucleus | ||||||
| Expt B |
1 peptide |
2 spectra |
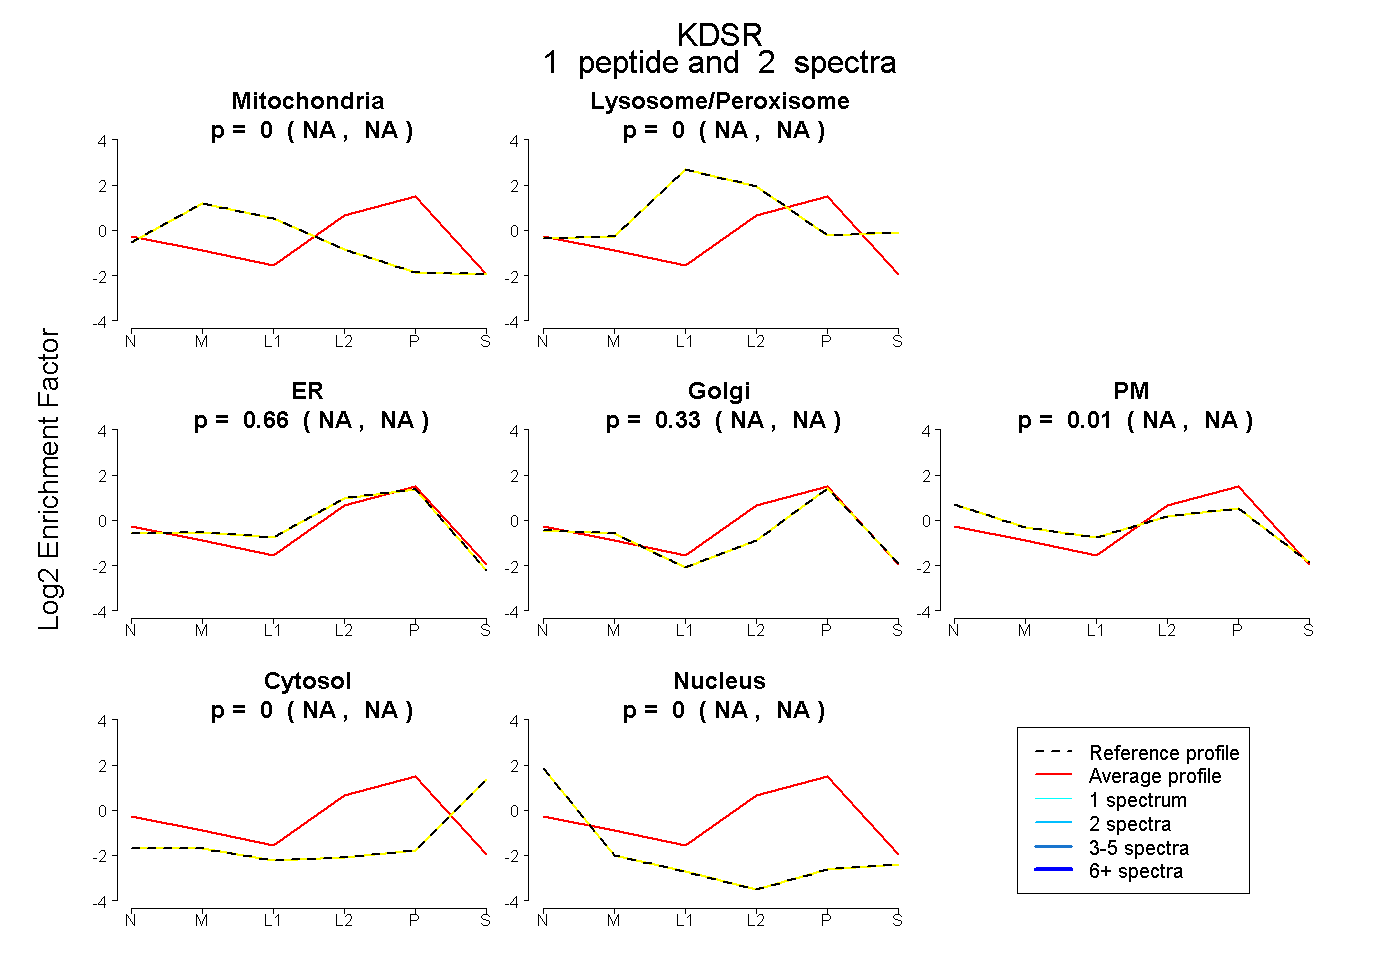 |
0.000 NA | NA |
0.000 NA | NA |
0.655 NA | NA |
0.334 NA | NA |
0.011 NA | NA |
0.000 NA | NA |
0.000 NA | NA |
|||
| Plot | Lyso | Other | |||||||||||
| Expt C |
4 peptides |
9 spectra |
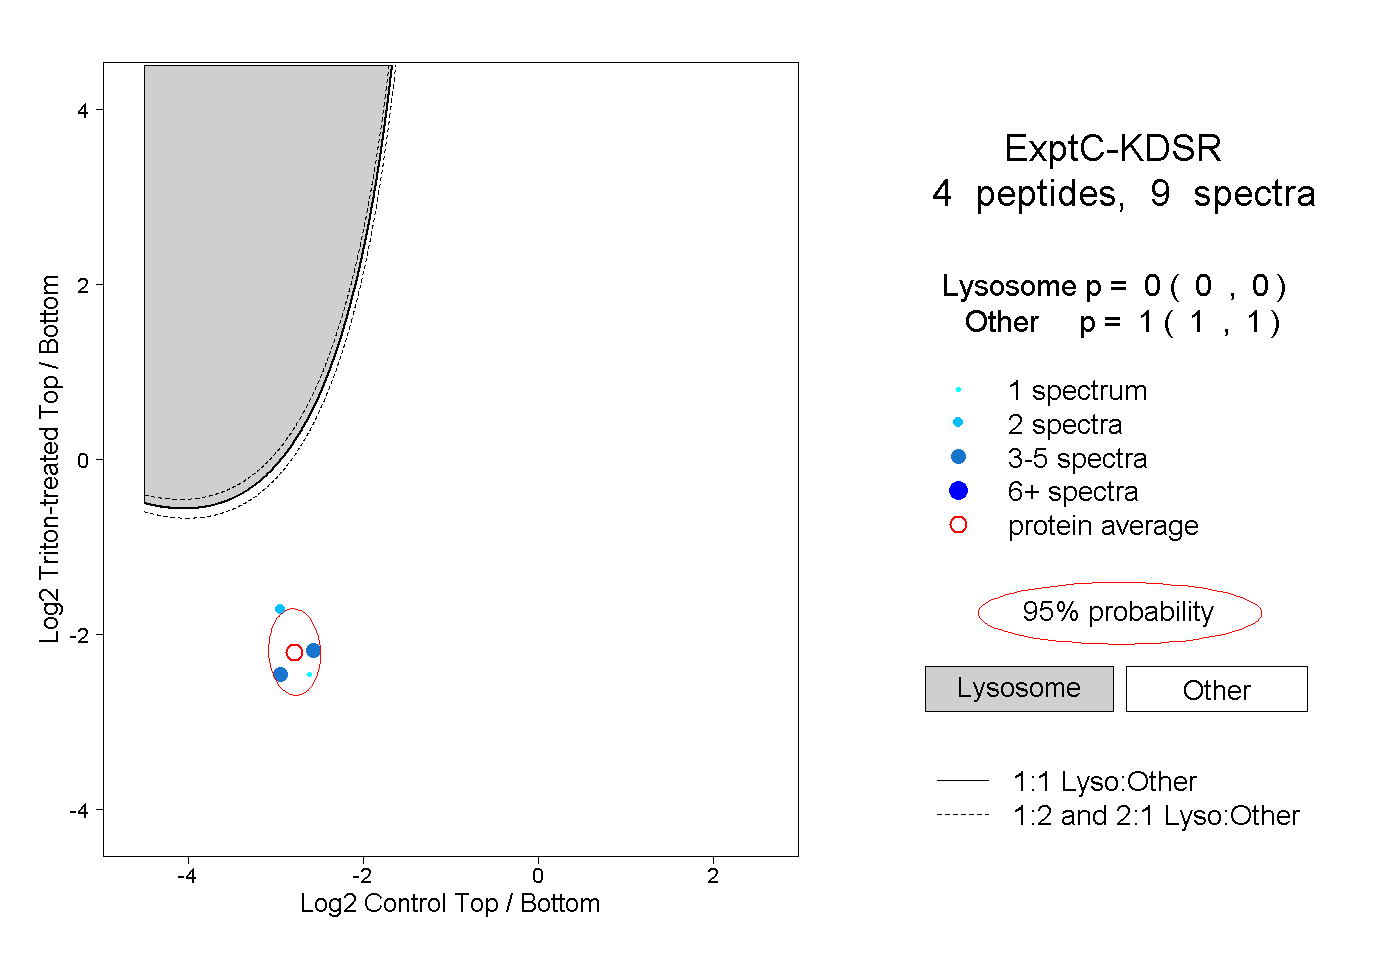 |
0.000 0.000 | 0.000 |
1.000 1.000 | 1.000 |