 4
4peptides
spectra
0.000 | 0.000
0.004 | 0.067
0.000 | 0.000
0.000 | 0.000
0.000 | 0.059
0.000 | 0.000
0.914 | 0.954
0.000 | 0.000
1peptide
spectrum
NA | NA
NA | NA
NA | NA
NA | NA
NA | NA
NA | NA
NA | NA
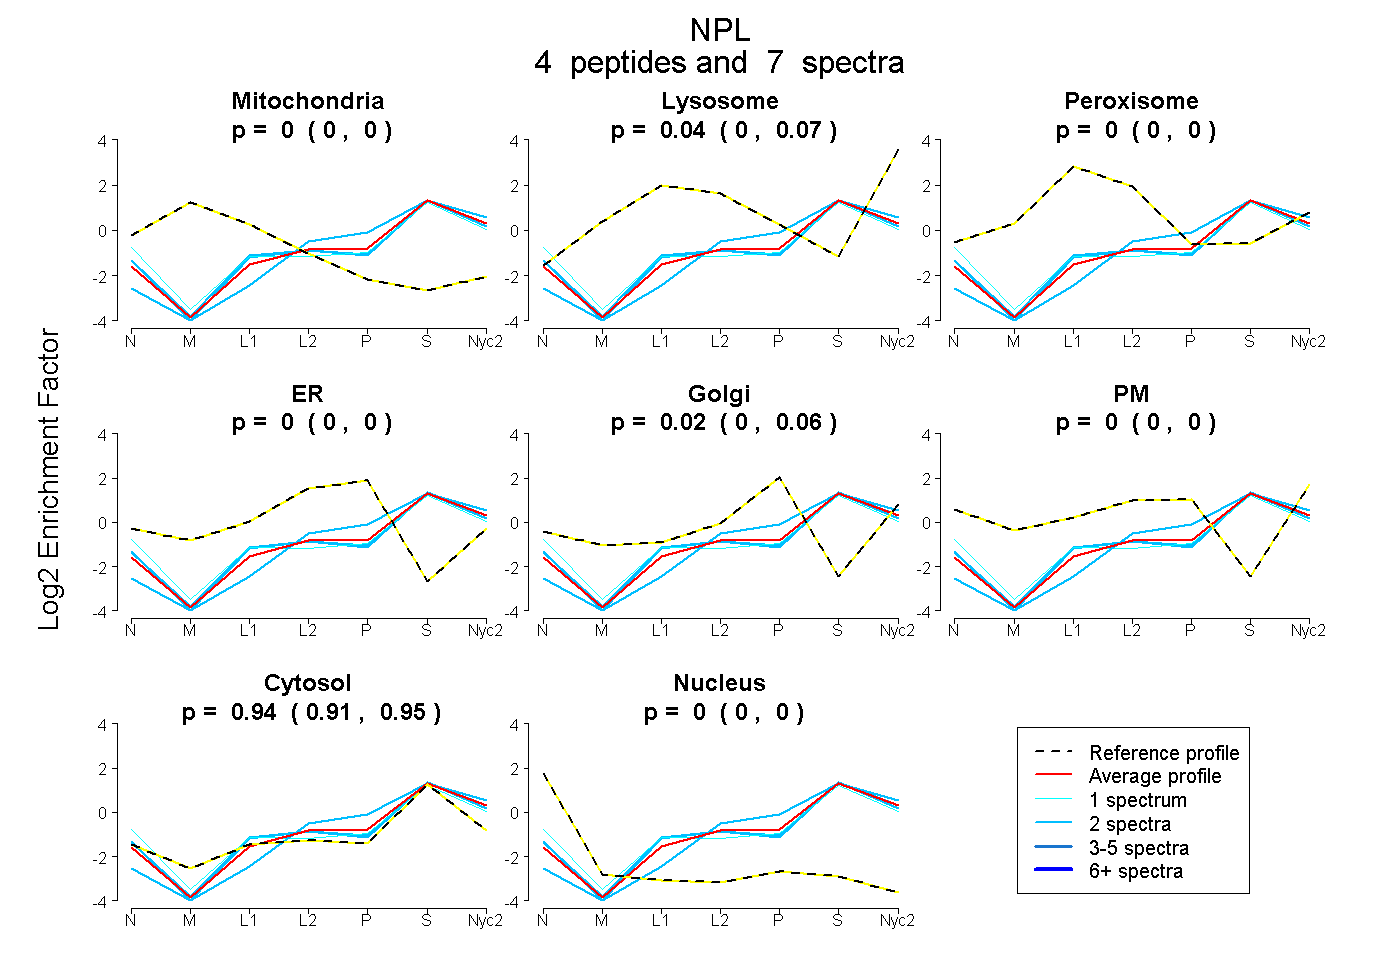
| Plot | Mito | Lyso | Perox | ER | Golgi | PM | Cytosol | Nucleus | |||||
| Expt A |
4 peptides |
7 spectra |
|
0.000 0.000 | 0.000 |
0.039 0.004 | 0.067 |
0.000 0.000 | 0.000 |
0.000 0.000 | 0.000 |
0.024 0.000 | 0.059 |
0.000 0.000 | 0.000 |
0.936 0.914 | 0.954 |
0.000 0.000 | 0.000 |
||
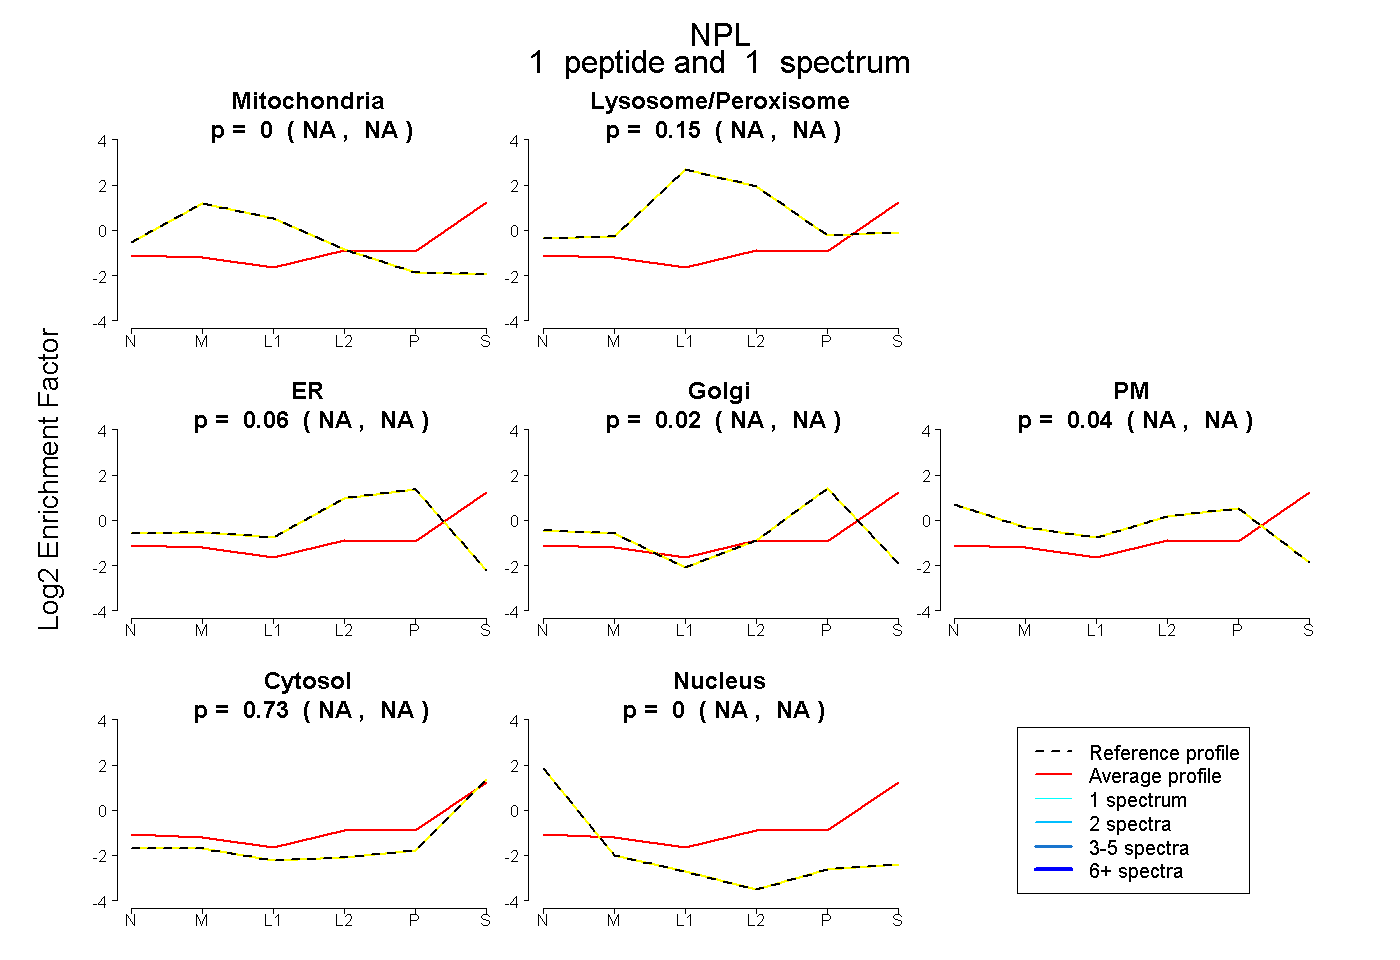
| Plot | Mito | Lyso or Perox | ER | Golgi | PM | Cytosol | Nucleus | ||||||
| Expt B |
1 peptide |
1 spectrum |
|
0.000 NA | NA |
0.146 NA | NA |
0.059 NA | NA |
0.020 NA | NA |
0.042 NA | NA |
0.733 NA | NA |
0.000 NA | NA |
| 1 spectrum, DALISFLR | 0.000 | 0.146 | 0.059 | 0.020 | 0.042 | 0.733 | 0.000 |
| Plot | Lyso | Other | |||||||||||
| Expt C |
2 peptides |
5 spectra |
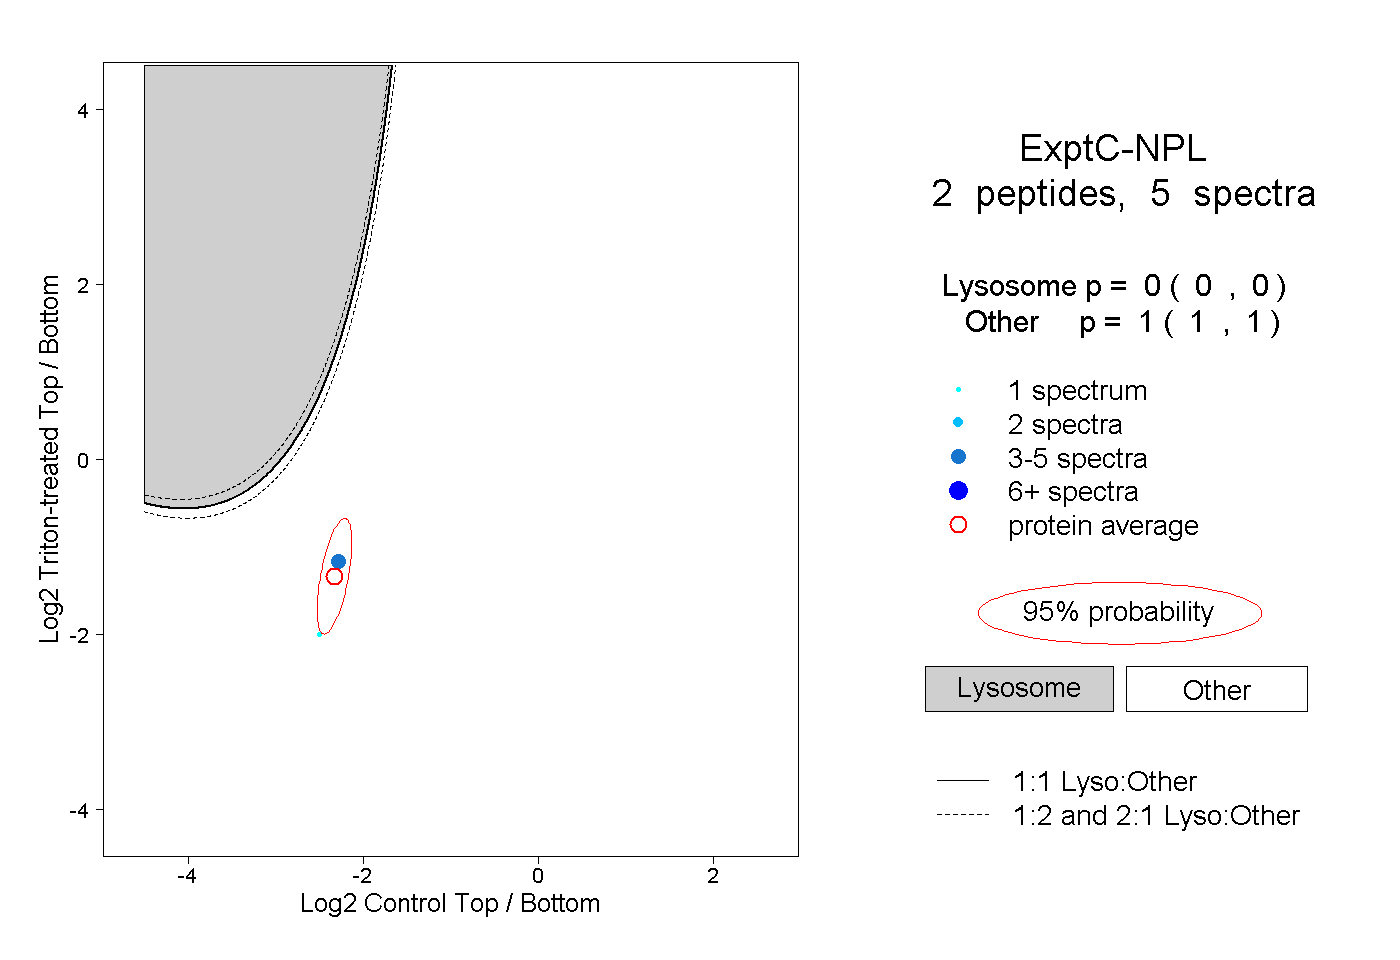 |
0.000 0.000 | 0.000 |
1.000 1.000 | 1.000 |