16
16peptides
spectra
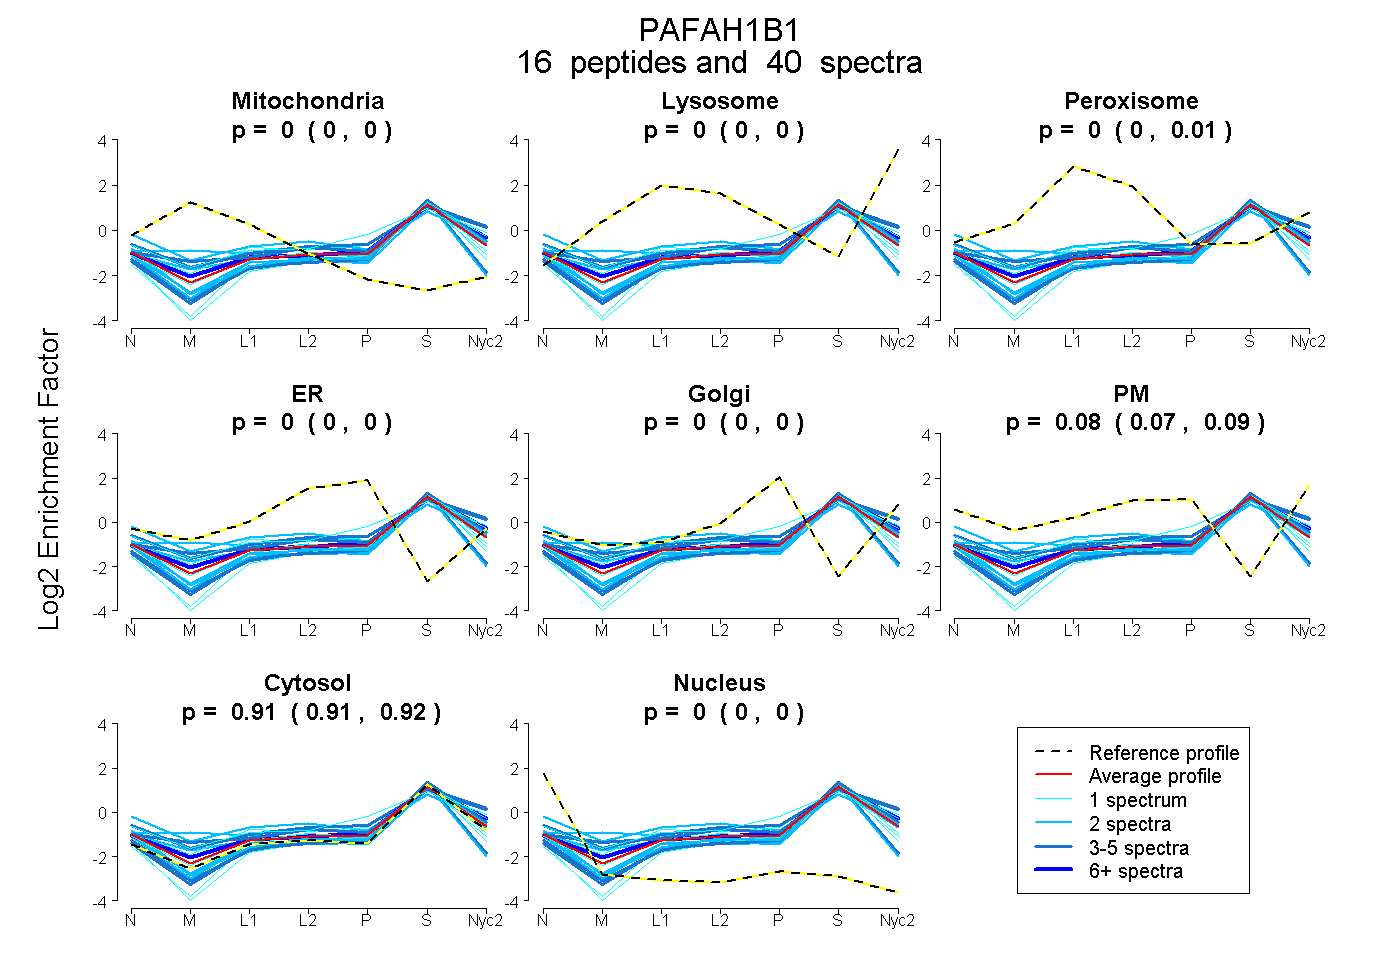
0.000 | 0.000
0.000 | 0.000
0.000 | 0.010
0.000 | 0.003
0.000 | 0.000
0.074 | 0.088
0.907 | 0.917
0.000 | 0.001
5peptides
spectra
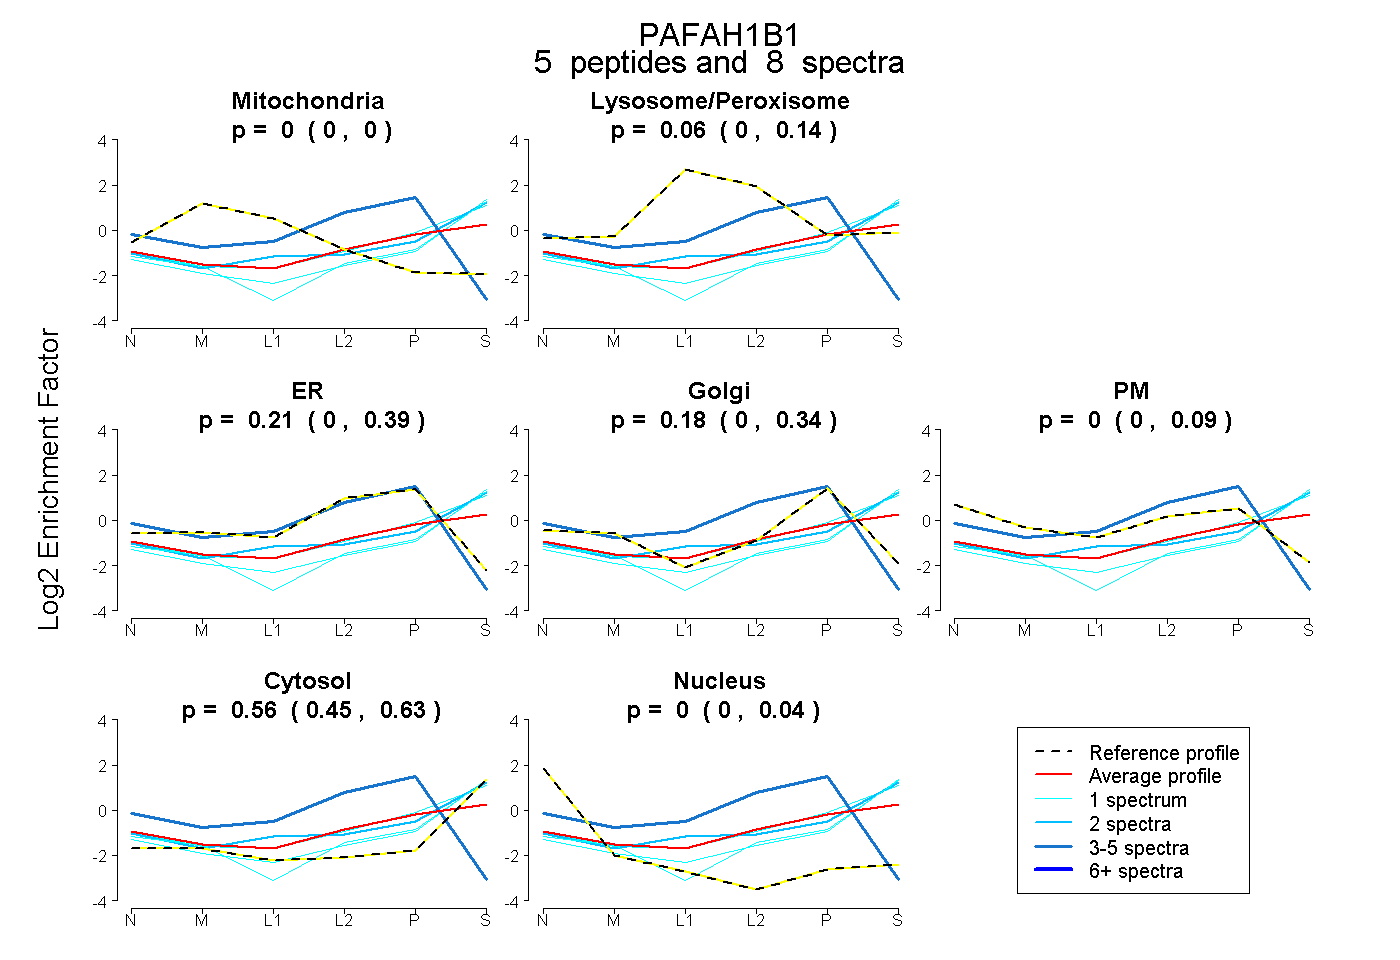
0.000 | 0.000
0.000 | 0.145
0.000 | 0.389
0.000 | 0.339
0.000 | 0.094
0.454 | 0.627
0.000 | 0.043