 16
16peptides
spectra
0.000 | 0.000
0.000 | 0.000
0.000 | 0.010
0.000 | 0.003
0.000 | 0.000
0.074 | 0.088
0.907 | 0.917
0.000 | 0.001
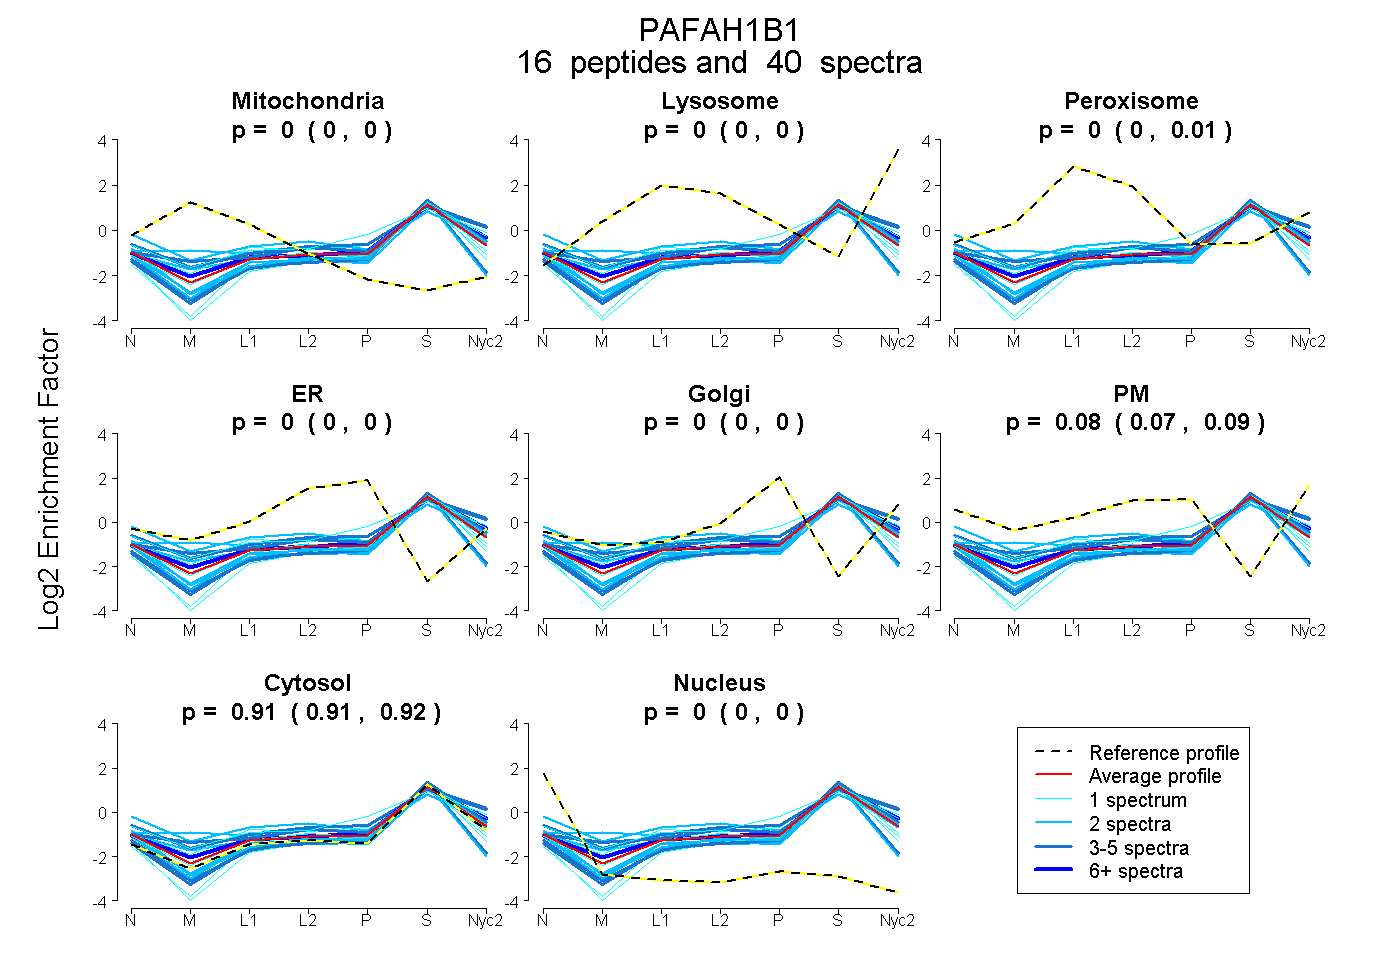
| Plot | Mito | Lyso | Perox | ER | Golgi | PM | Cytosol | Nucleus | |||||
| Expt A |
16 peptides |
40 spectra |
|
0.000 0.000 | 0.000 |
0.000 0.000 | 0.000 |
0.003 0.000 | 0.010 |
0.000 0.000 | 0.003 |
0.000 0.000 | 0.000 |
0.084 0.074 | 0.088 |
0.913 0.907 | 0.917 |
0.000 0.000 | 0.001 |
| 2 spectra, EWIPRPPEK | 0.195 | 0.054 | 0.004 | 0.000 | 0.000 | 0.000 | 0.747 | 0.000 | ||
| 3 spectra, VWDYETGDFER | 0.000 | 0.000 | 0.000 | 0.000 | 0.000 | 0.000 | 1.000 | 0.000 | ||
| 2 spectra, VWVVATK | 0.000 | 0.000 | 0.000 | 0.000 | 0.000 | 0.038 | 0.934 | 0.029 | ||
| 1 spectrum, GVLFHSGGK | 0.000 | 0.000 | 0.000 | 0.000 | 0.000 | 0.000 | 1.000 | 0.000 | ||
| 2 spectra, SGKPGPFLLSGSR | 0.000 | 0.000 | 0.000 | 0.000 | 0.000 | 0.038 | 0.962 | 0.000 | ||
| 2 spectra, MWEVQTGYCVK | 0.045 | 0.000 | 0.039 | 0.000 | 0.000 | 0.058 | 0.858 | 0.000 | ||
| 1 spectrum, YAGLLEK | 0.000 | 0.051 | 0.000 | 0.000 | 0.000 | 0.046 | 0.903 | 0.000 | ||
| 4 spectra, LWDFQGFECIR | 0.000 | 0.000 | 0.000 | 0.000 | 0.000 | 0.000 | 0.915 | 0.085 | ||
| 4 spectra, WTSVIR | 0.000 | 0.142 | 0.000 | 0.000 | 0.000 | 0.075 | 0.783 | 0.000 | ||
| 1 spectrum, YALSGHR | 0.000 | 0.012 | 0.059 | 0.000 | 0.099 | 0.124 | 0.706 | 0.000 | ||
| 3 spectra, VISQR | 0.000 | 0.069 | 0.000 | 0.000 | 0.000 | 0.185 | 0.746 | 0.000 | ||
| 1 spectrum, SNGYEEAYSVFK | 0.000 | 0.000 | 0.000 | 0.000 | 0.000 | 0.000 | 0.953 | 0.047 | ||
| 2 spectra, FILSCADDK | 0.000 | 0.000 | 0.180 | 0.000 | 0.000 | 0.134 | 0.640 | 0.046 | ||
| 2 spectra, MVRPNQDGTLIASCSNDQTVR | 0.000 | 0.000 | 0.000 | 0.000 | 0.000 | 0.000 | 0.896 | 0.104 | ||
| 9 spectra, VMELESK | 0.000 | 0.039 | 0.000 | 0.000 | 0.000 | 0.092 | 0.868 | 0.000 | ||
| 1 spectrum, TLNAHEHFVTSLDFHK | 0.010 | 0.000 | 0.088 | 0.087 | 0.000 | 0.000 | 0.815 | 0.000 |
| Plot | Mito | Lyso or Perox | ER | Golgi | PM | Cytosol | Nucleus | ||||||
| Expt B |
5 peptides |
8 spectra |
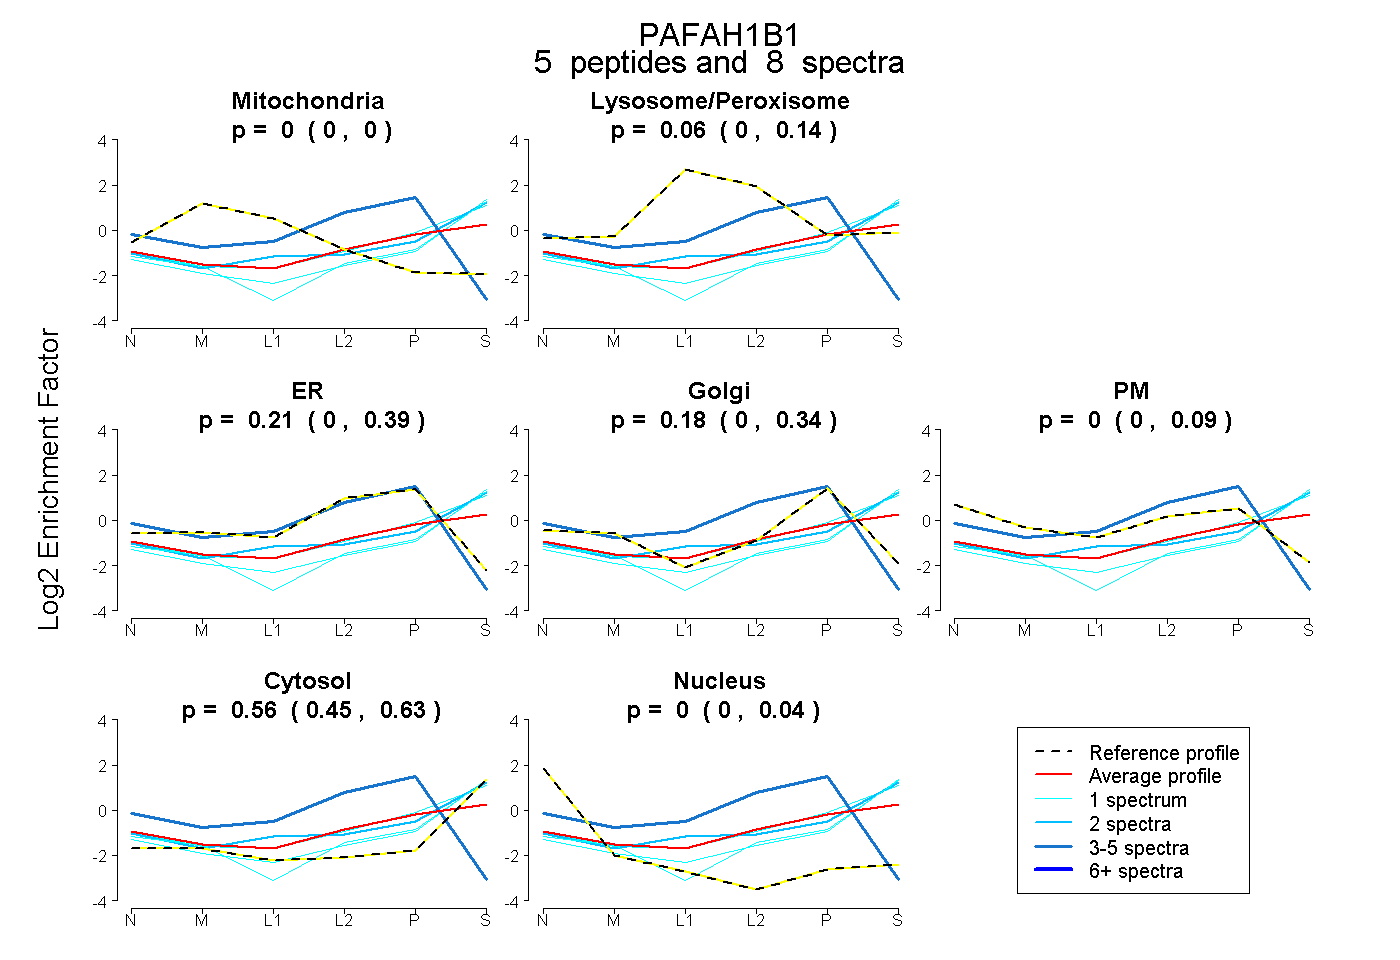 |
0.000 0.000 | 0.000 |
0.056 0.000 | 0.145 |
0.213 0.000 | 0.389 |
0.176 0.000 | 0.339 |
0.000 0.000 | 0.094 |
0.555 0.454 | 0.627 |
0.000 0.000 | 0.043 |
|||
| Plot | Lyso | Other | |||||||||||
| Expt C |
13 peptides |
37 spectra |
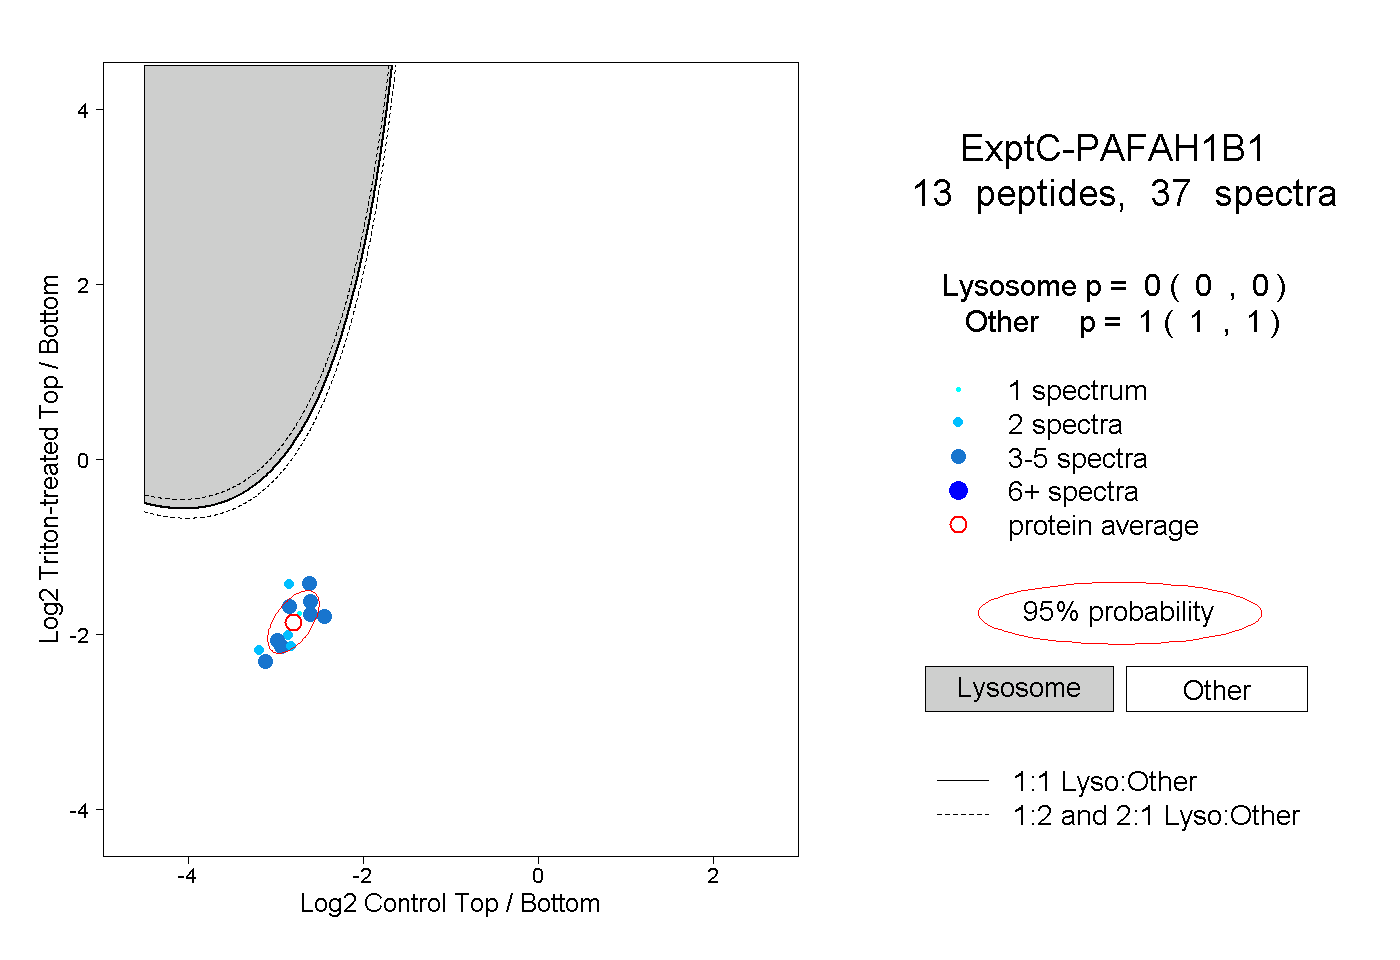 |
0.000 0.000 | 0.000 |
1.000 1.000 | 1.000 |
||||||||
| Plot | Lyso | Other | |||||||||||
| Expt D |
1 peptide |
2 spectra |
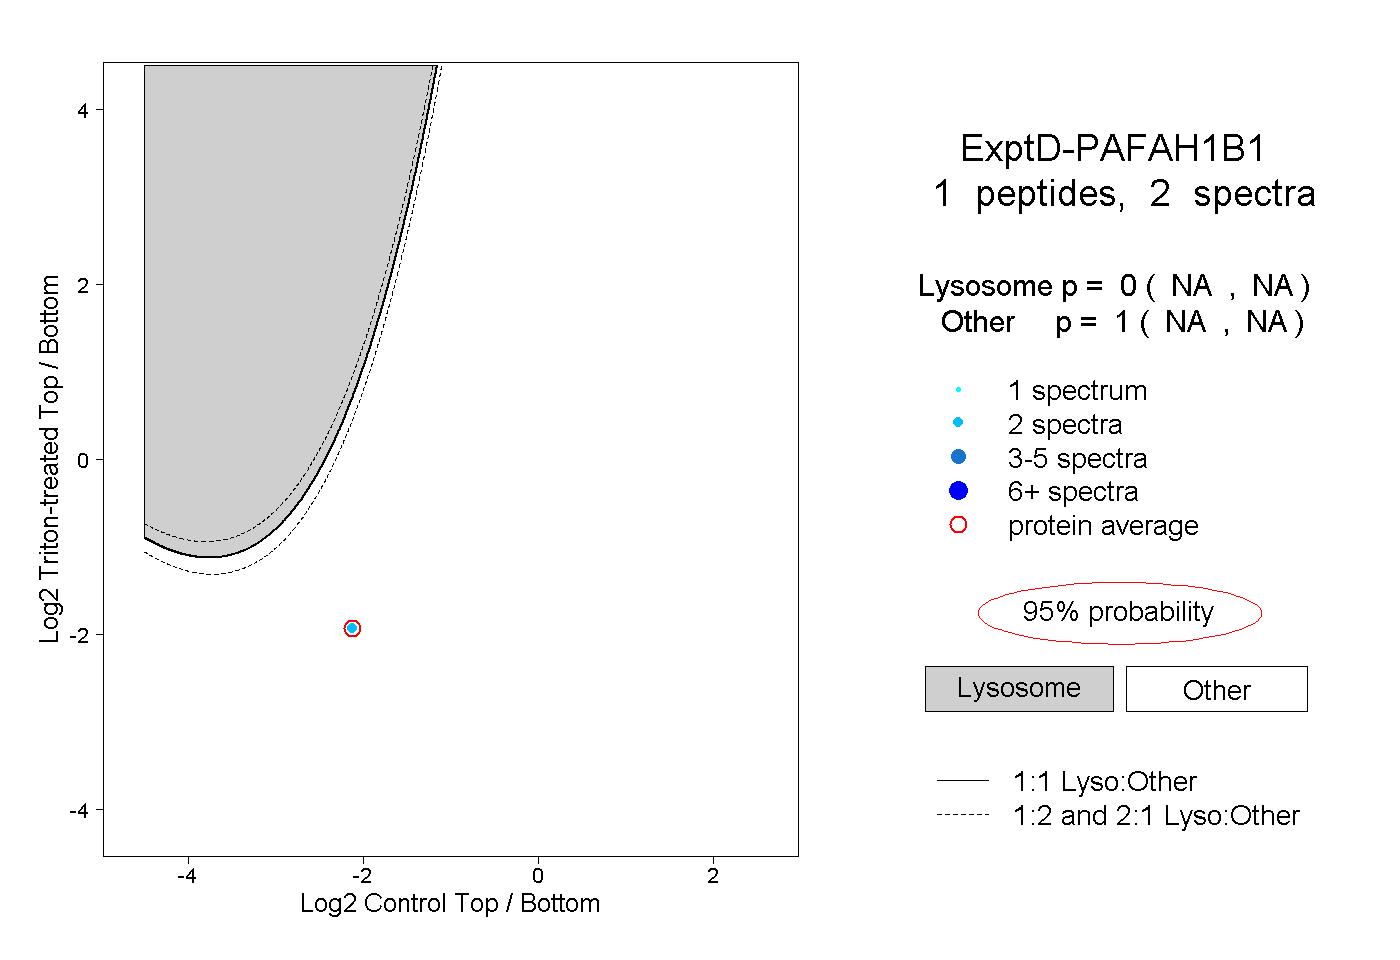 |
0.000 NA | NA |
1.000 NA | NA |