 2
2peptides
spectra
0.000 | 0.000
0.000 | 0.000
0.000 | 0.000
0.000 | 0.313
0.005 | 0.389
0.000 | 0.000
0.515 | 0.672
0.000 | 0.069
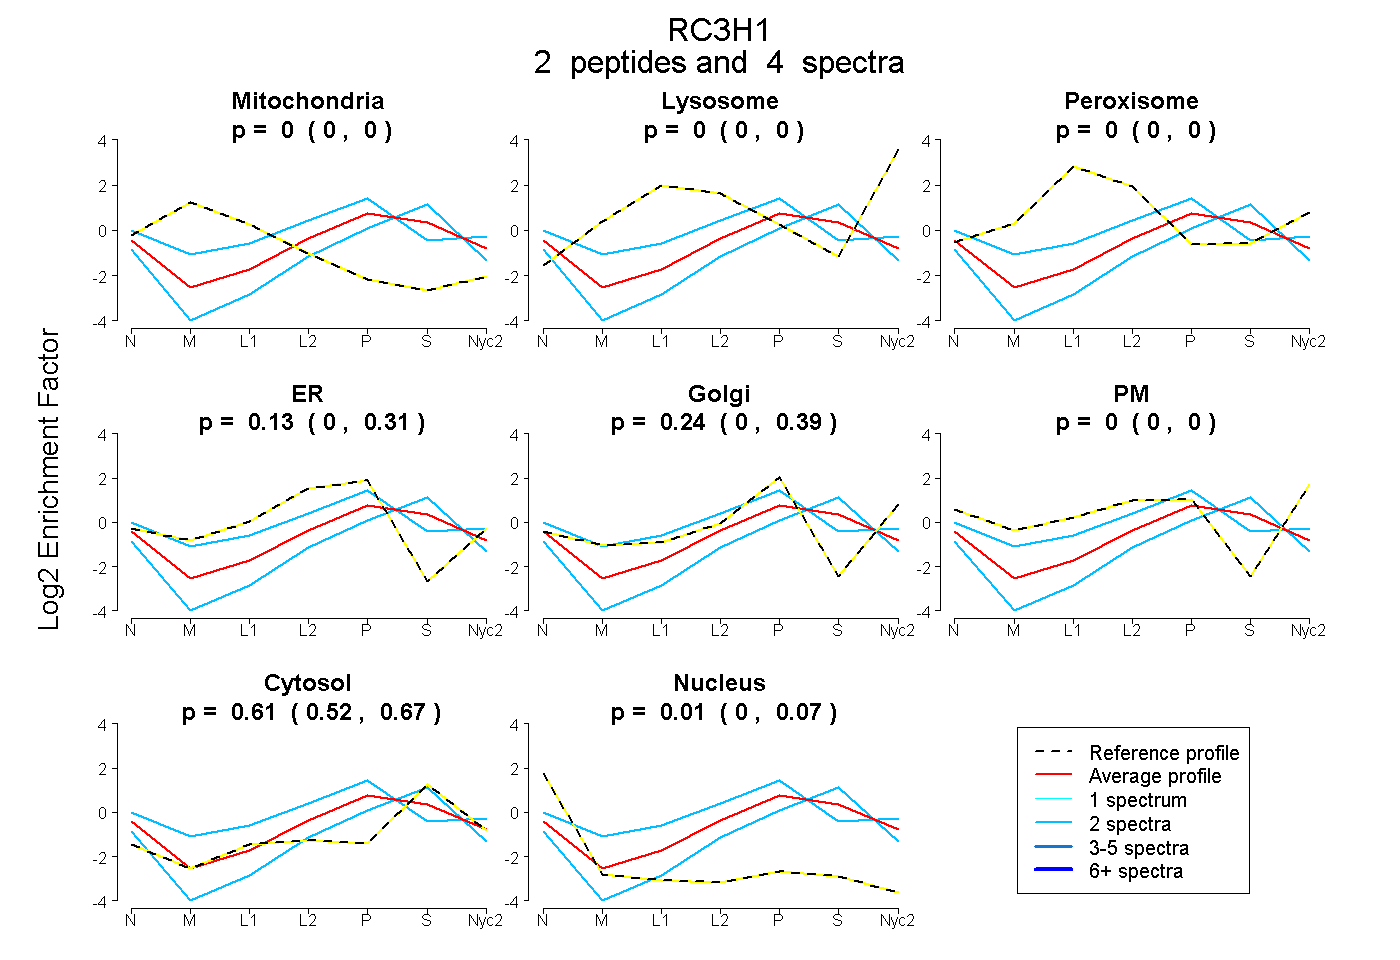
| Plot | Mito | Lyso | Perox | ER | Golgi | PM | Cytosol | Nucleus | |||||
| Expt A |
2 peptides |
4 spectra |
|
0.000 0.000 | 0.000 |
0.000 0.000 | 0.000 |
0.000 0.000 | 0.000 |
0.134 0.000 | 0.313 |
0.242 0.005 | 0.389 |
0.000 0.000 | 0.000 |
0.610 0.515 | 0.672 |
0.015 0.000 | 0.069 |