41
41peptides
spectra
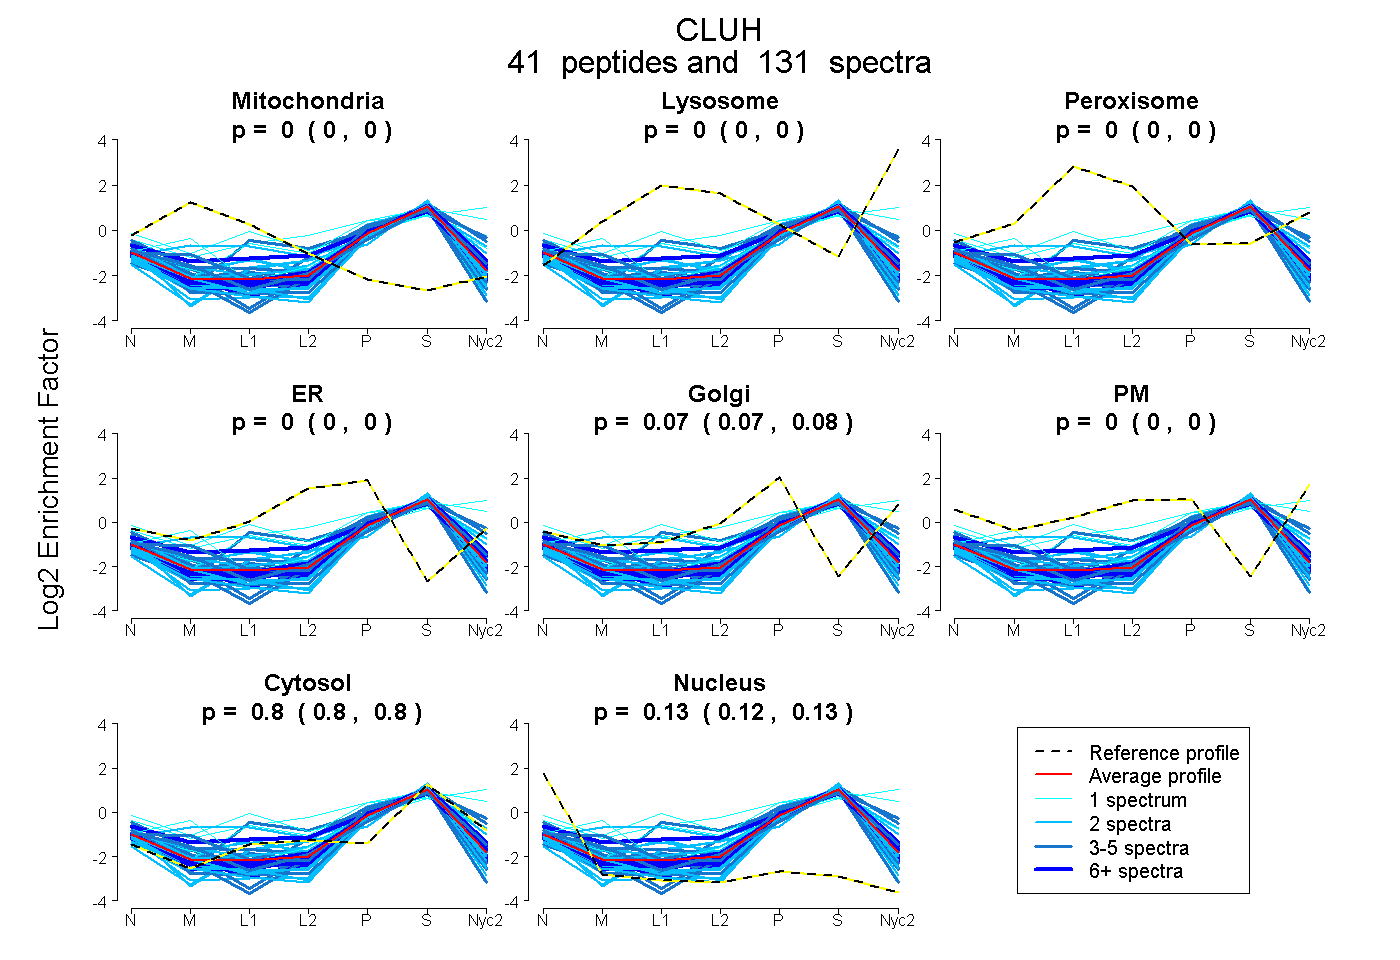
0.000 | 0.000
0.000 | 0.000
0.000 | 0.000
0.000 | 0.000
0.072 | 0.075
0.000 | 0.000
0.798 | 0.800
0.125 | 0.129
24peptides
spectra
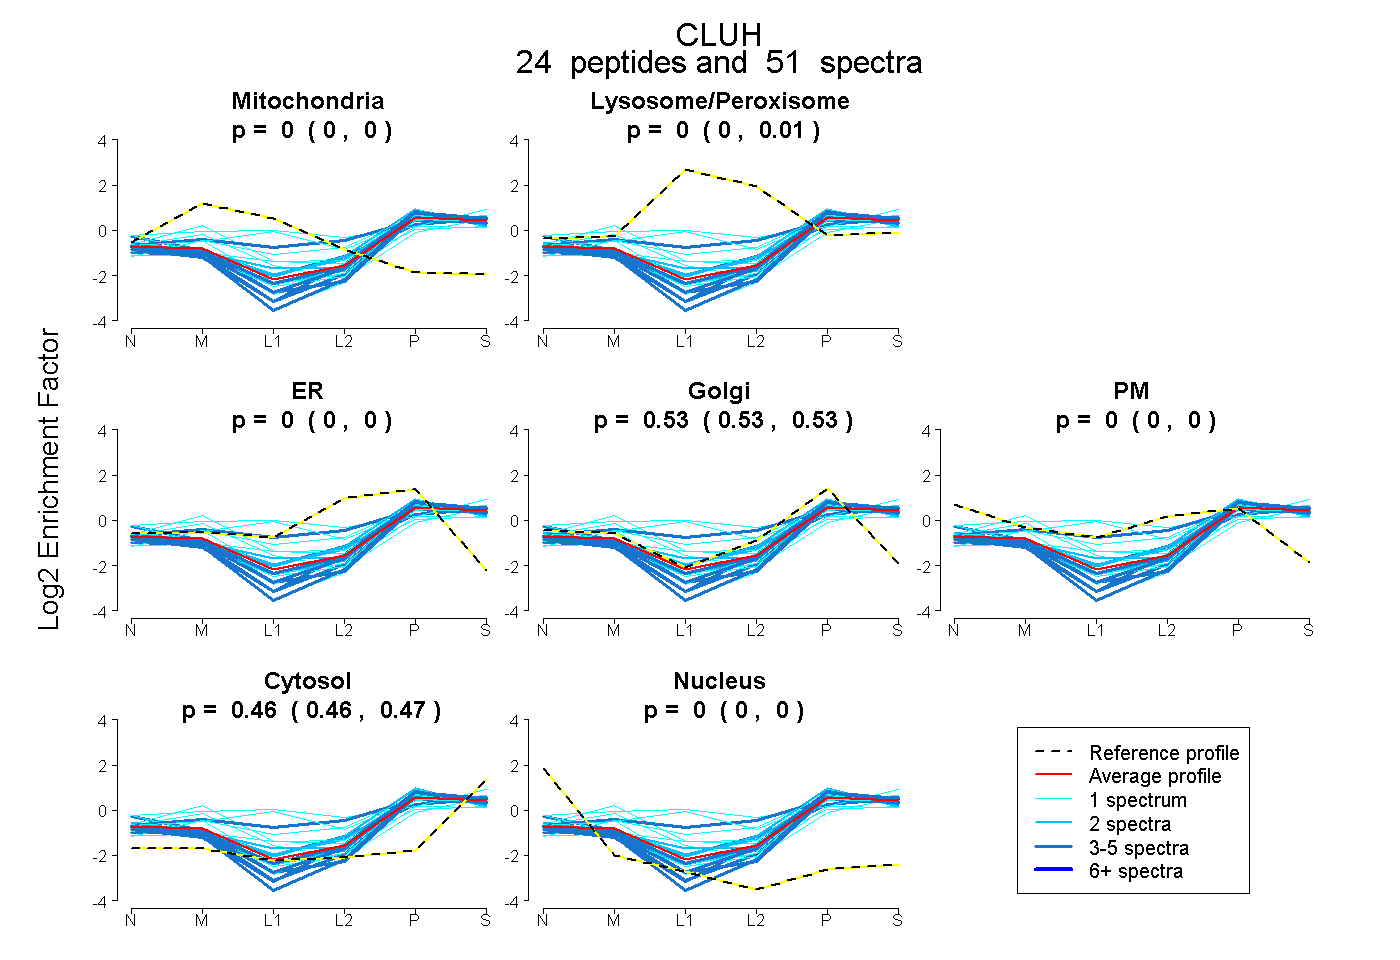
0.000 | 0.000
0.000 | 0.011
0.000 | 0.000
0.525 | 0.535
0.000 | 0.000
0.460 | 0.467
0.000 | 0.000
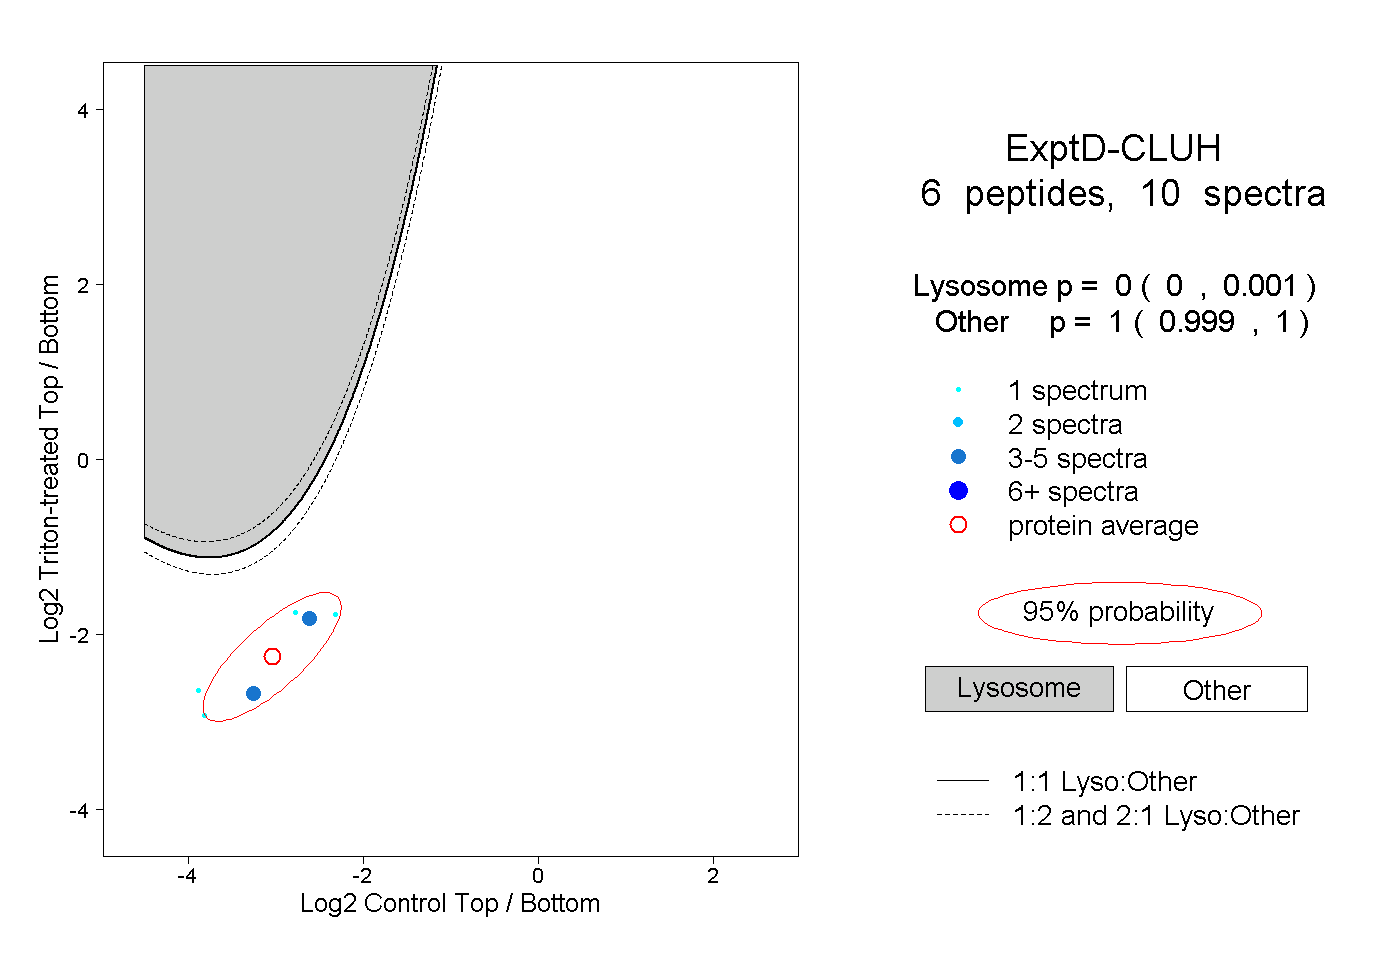
28peptides
spectra
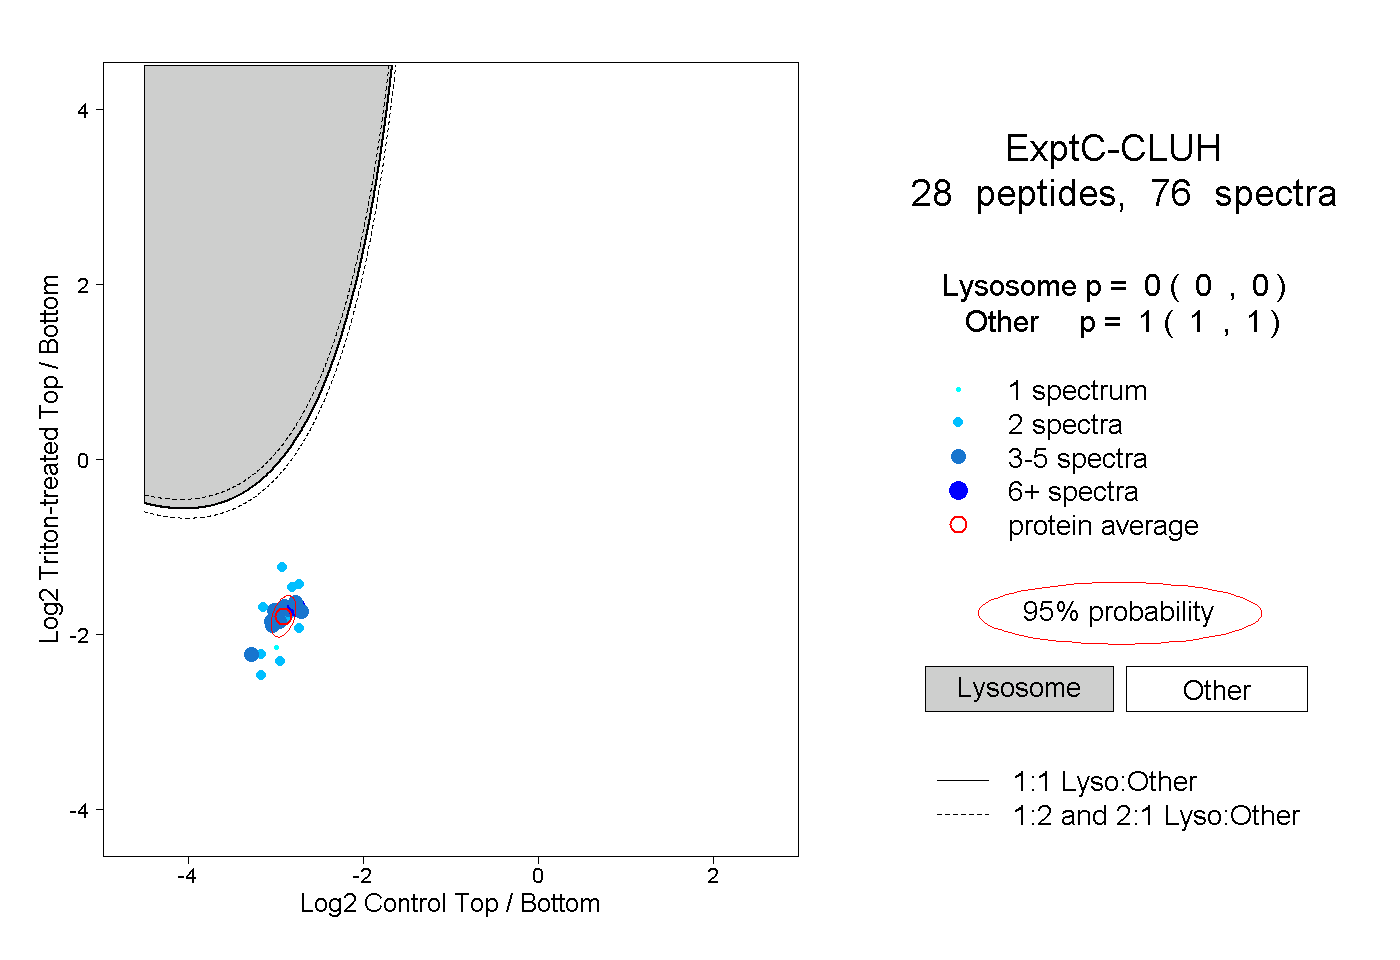
0.000 | 0.000
1.000 | 1.000