 3
3peptides
spectra
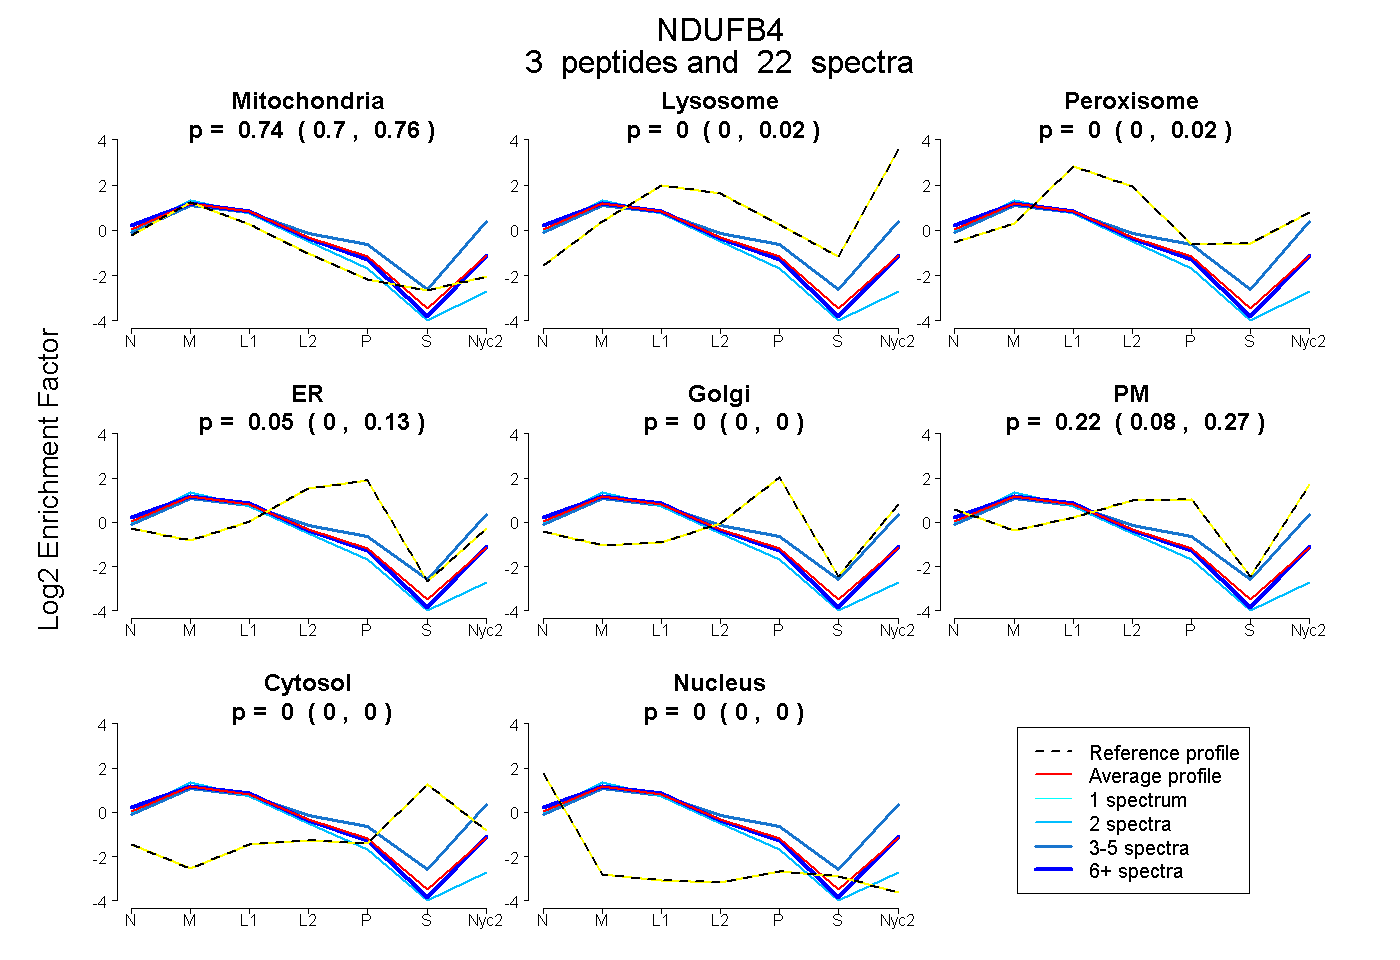
0.701 | 0.765
0.000 | 0.025
0.000 | 0.016
0.000 | 0.131
0.000 | 0.000
0.080 | 0.273
0.000 | 0.000
0.000 | 0.000
3peptides
spectra
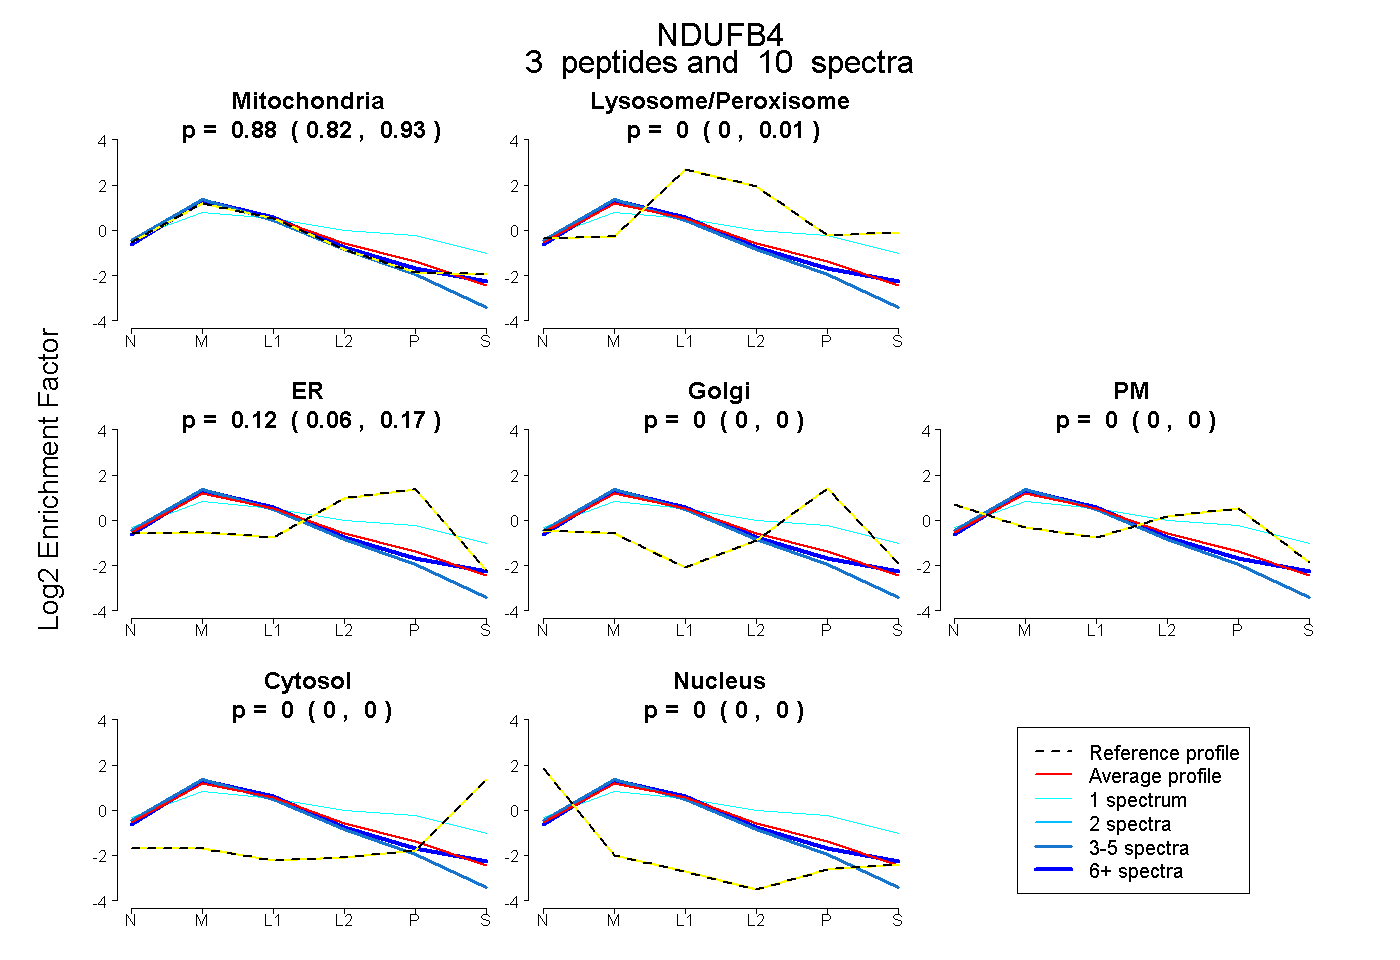
0.823 | 0.928
0.000 | 0.008
0.059 | 0.168
0.000 | 0.000
0.000 | 0.000
0.000 | 0.000
0.000 | 0.000
4peptides
spectra
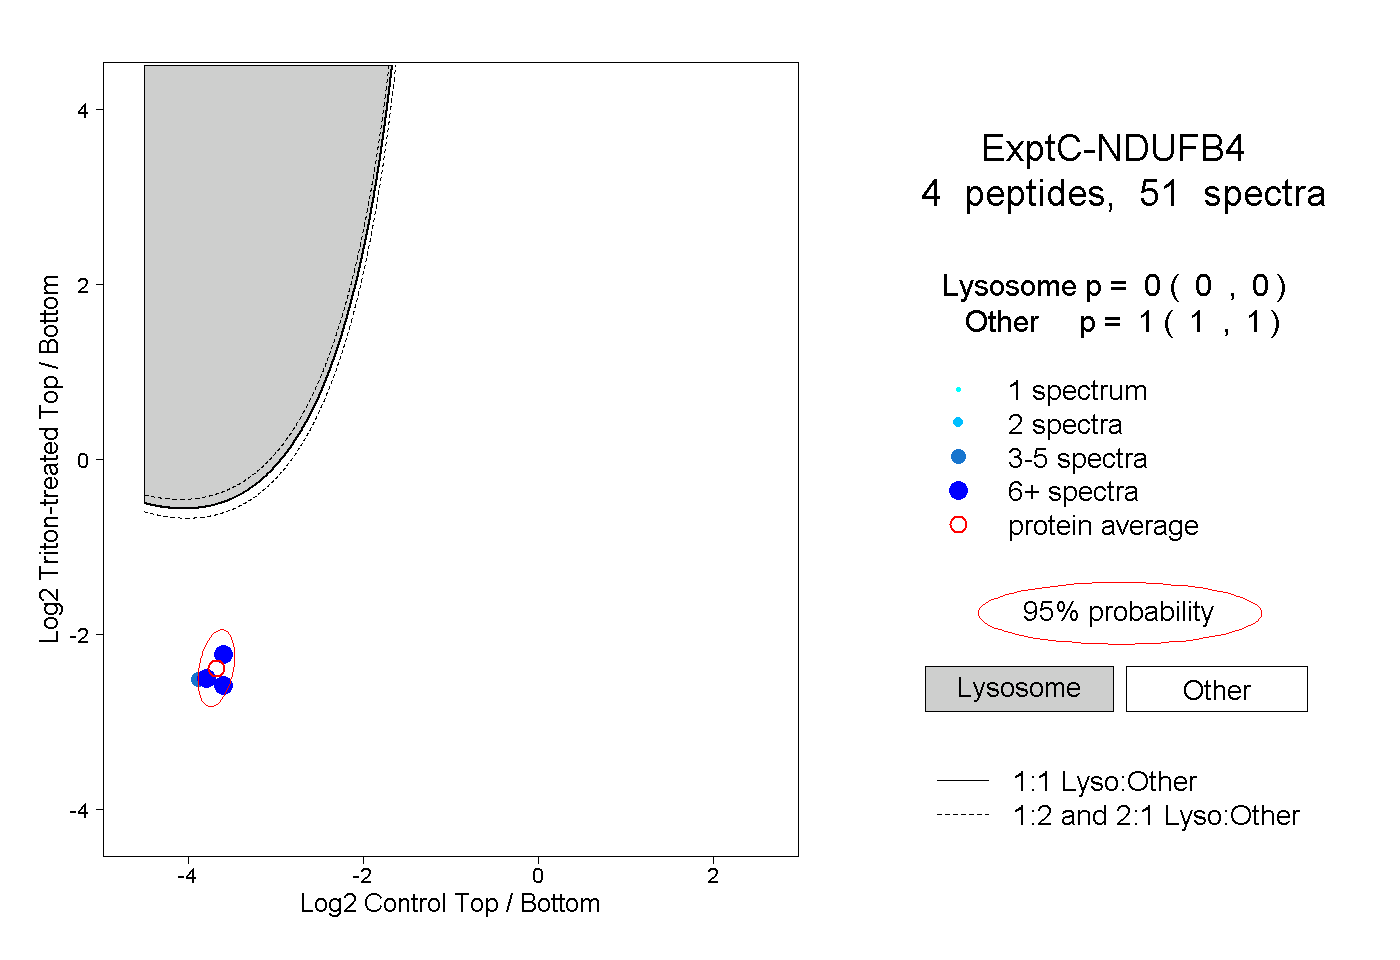
0.000 | 0.000
1.000 | 1.000
1peptide
spectra
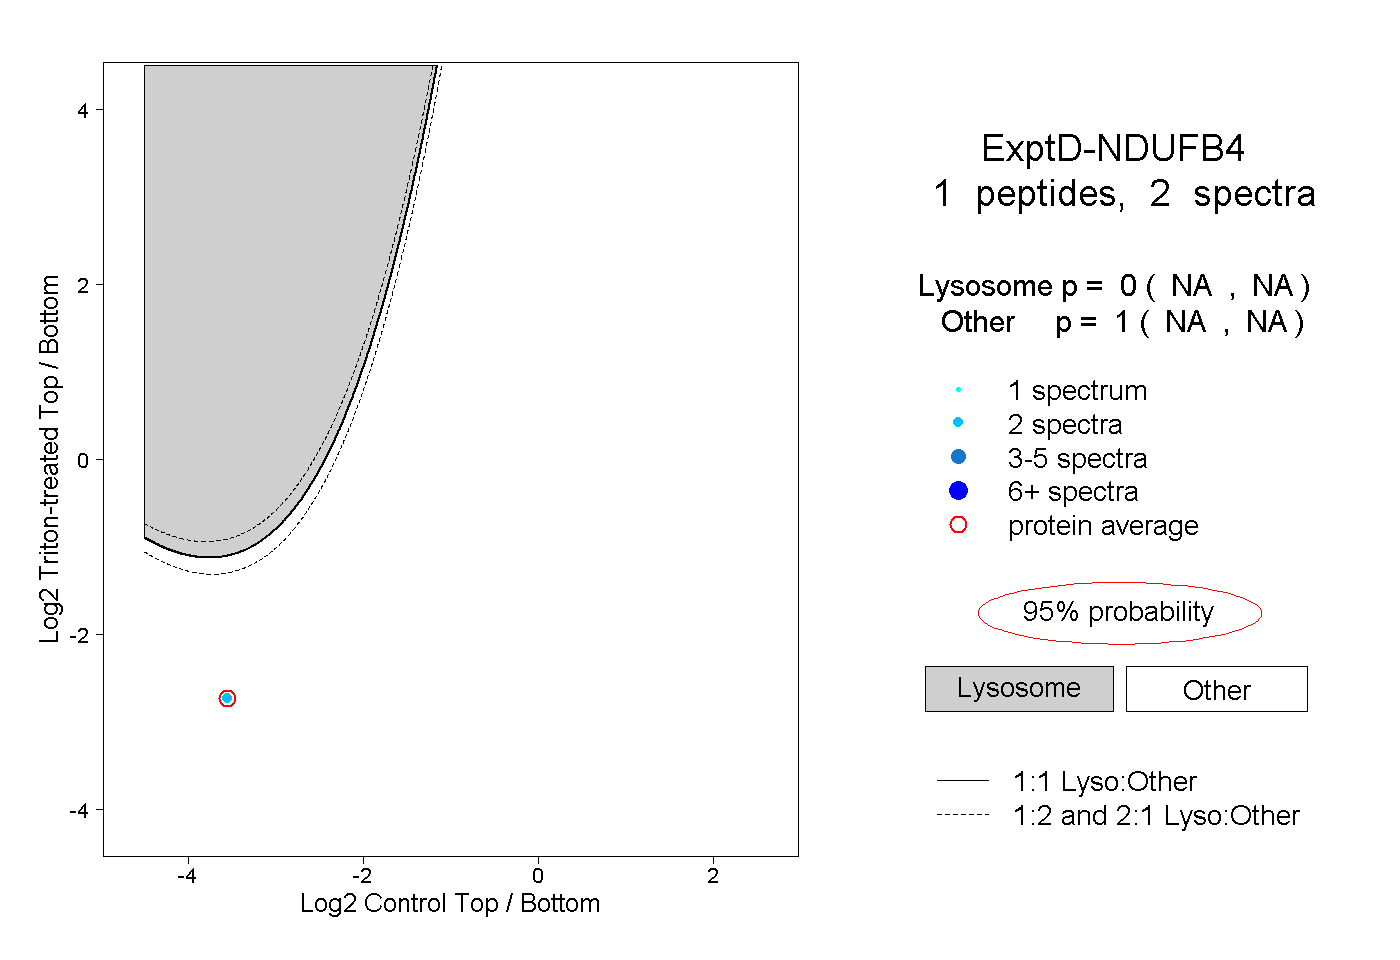
NA | NA
NA | NA