 4
4peptides
spectra
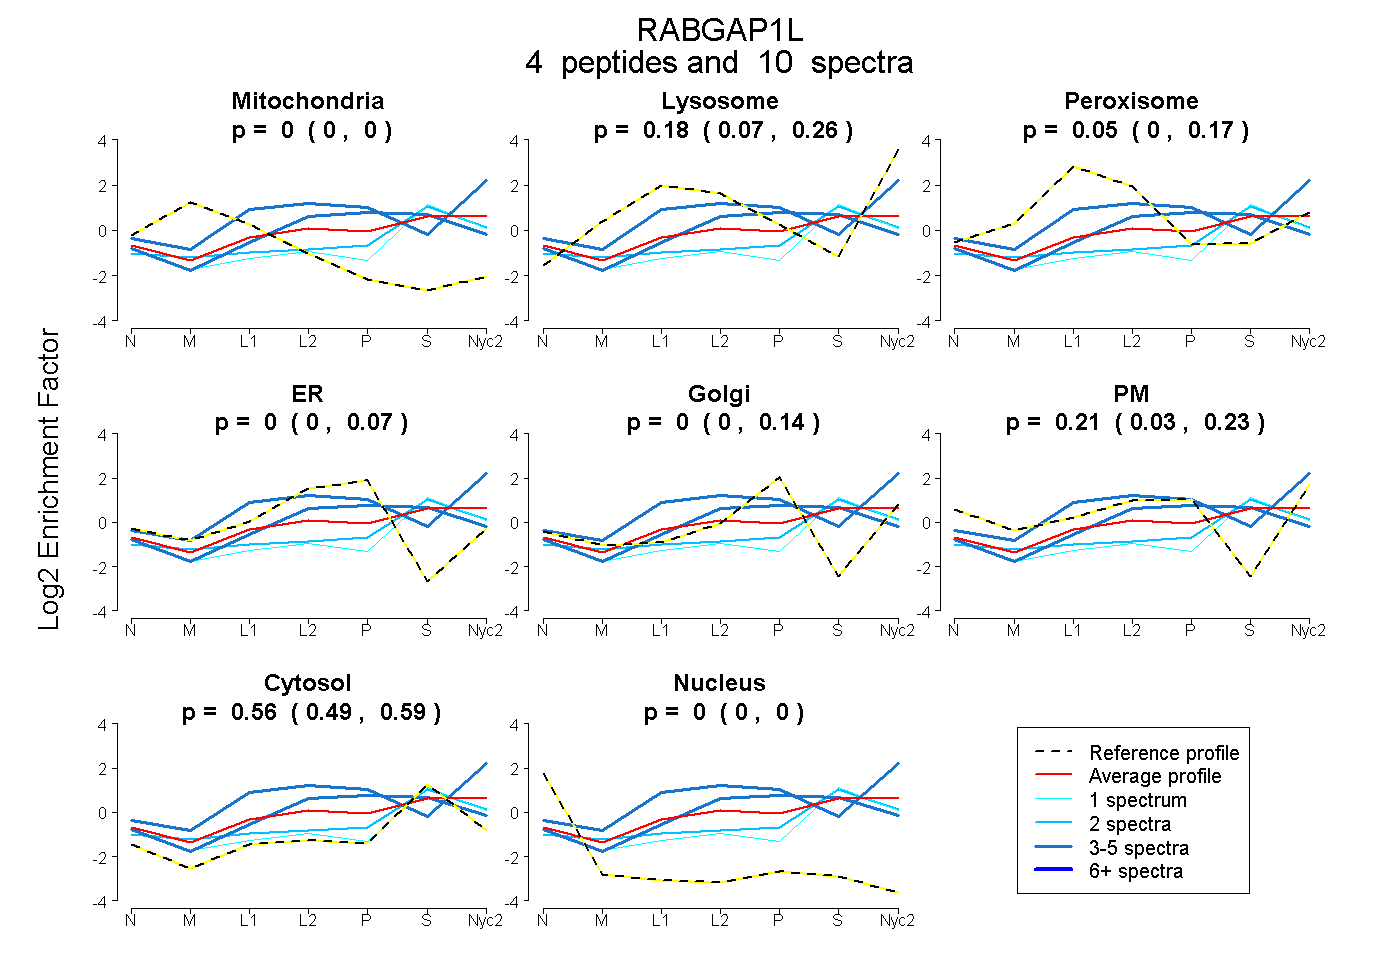
0.000 | 0.000
0.074 | 0.263
0.000 | 0.175
0.000 | 0.067
0.000 | 0.139
0.029 | 0.233
0.489 | 0.588
0.000 | 0.000
| Plot | Mito | Lyso | Perox | ER | Golgi | PM | Cytosol | Nucleus | |||||
| Expt A |
4 peptides |
10 spectra |
|
0.000 0.000 | 0.000 |
0.183 0.074 | 0.263 |
0.052 0.000 | 0.175 |
0.000 0.000 | 0.067 |
0.000 0.000 | 0.139 |
0.209 0.029 | 0.233 |
0.556 0.489 | 0.588 |
0.000 0.000 | 0.000 |
| 2 spectra, DTGGDGQESLYK | 0.013 | 0.160 | 0.000 | 0.000 | 0.000 | 0.079 | 0.747 | 0.000 | ||
| 3 spectra, SEGEALR | 0.000 | 0.076 | 0.038 | 0.355 | 0.000 | 0.000 | 0.532 | 0.000 | ||
| 4 spectra, VIFCAR | 0.000 | 0.475 | 0.019 | 0.035 | 0.000 | 0.285 | 0.186 | 0.000 | ||
| 1 spectrum, EDLLQADFEGALK | 0.000 | 0.086 | 0.000 | 0.000 | 0.000 | 0.080 | 0.835 | 0.000 |
| Plot | Lyso | Other | |||||||||||
| Expt C |
2 peptides |
2 spectra |
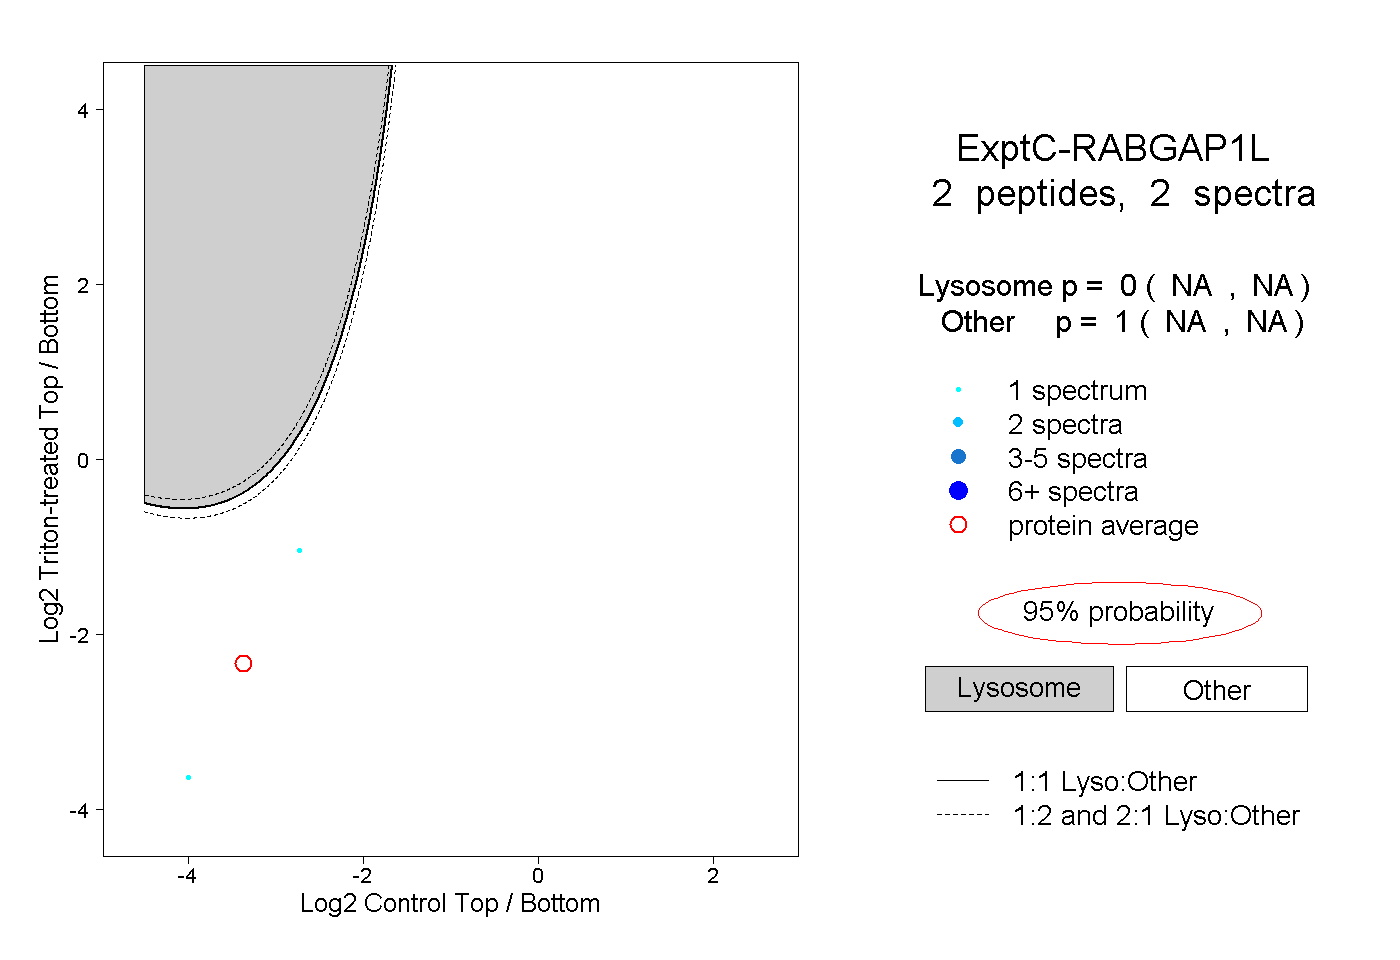 |
0.000 NA | NA |
1.000 NA | NA |