 22
22peptides
spectra
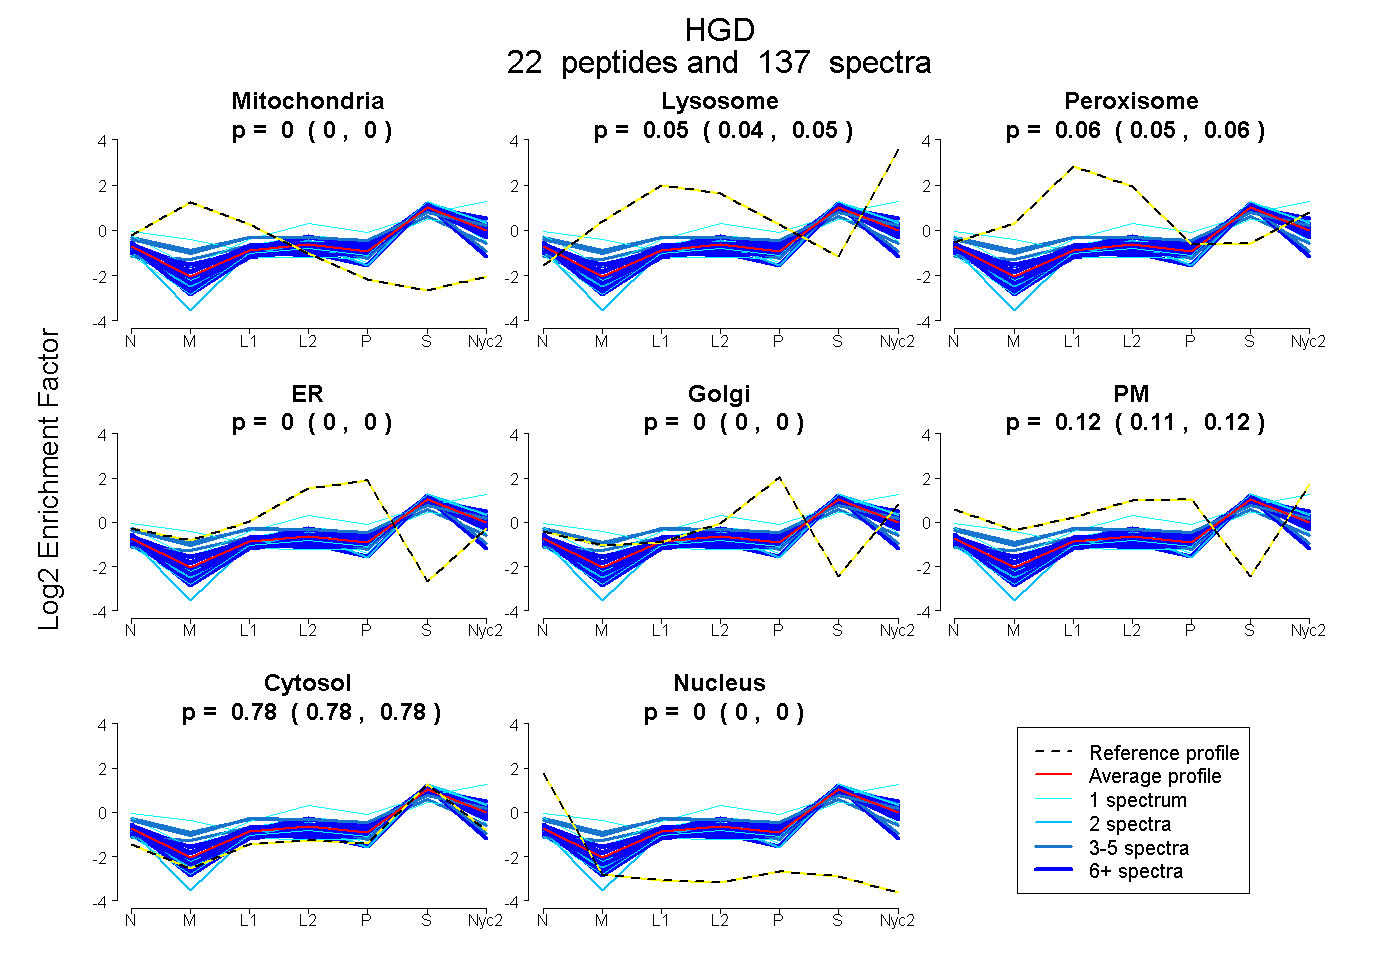
0.000 | 0.000
0.040 | 0.051
0.053 | 0.062
0.000 | 0.000
0.000 | 0.000
0.113 | 0.119
0.778 | 0.782
0.000 | 0.000
15peptides
spectra
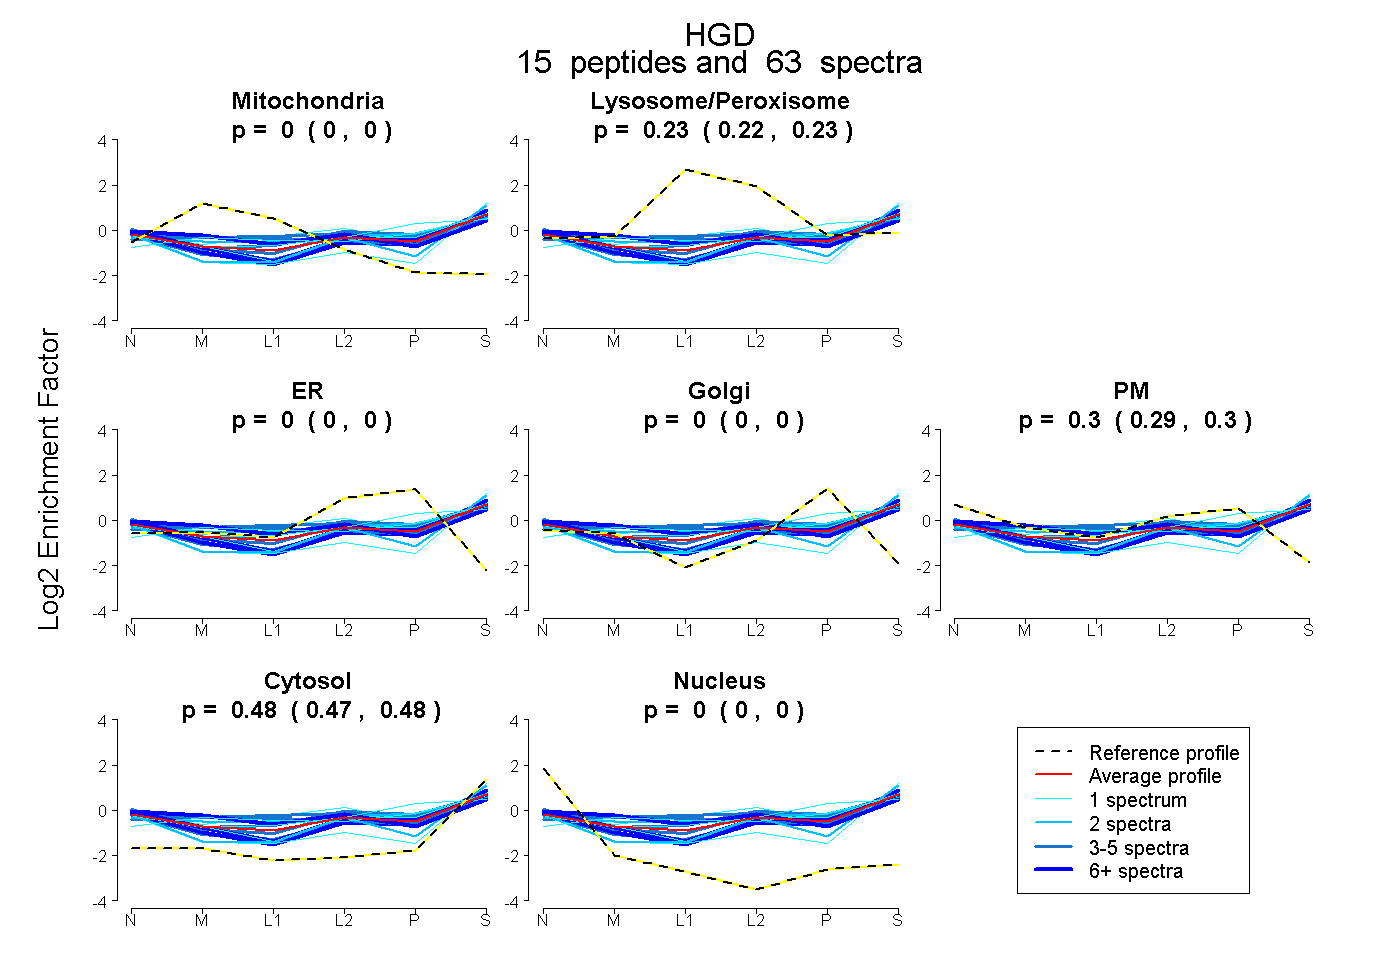
0.000 | 0.000
0.222 | 0.233
0.000 | 0.000
0.000 | 0.000
0.291 | 0.301
0.473 | 0.479
0.000 | 0.000
16peptides
spectra
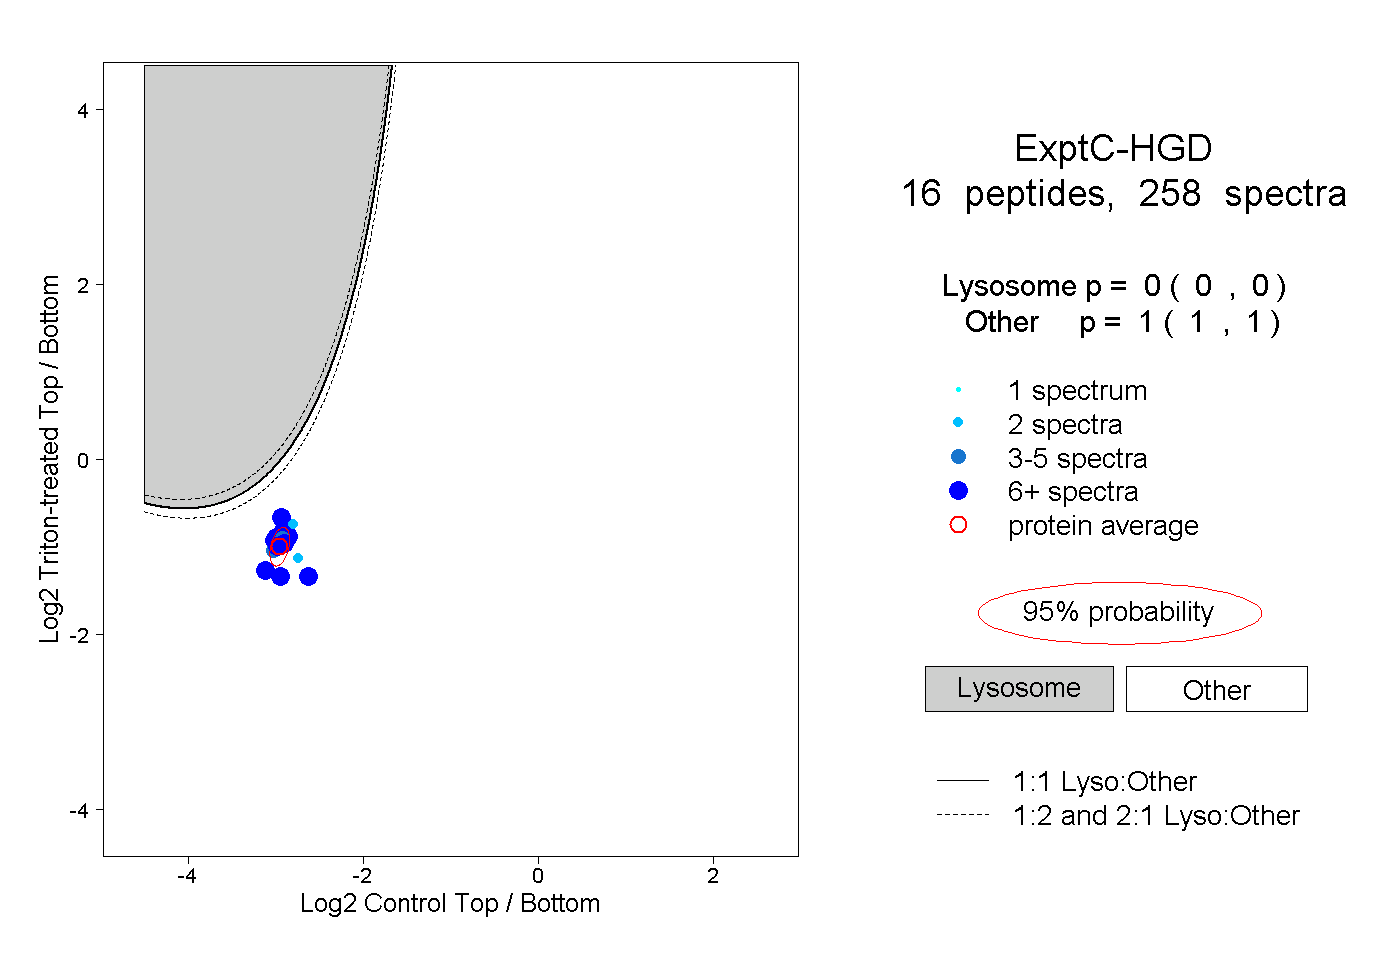
0.000 | 0.000
1.000 | 1.000
6peptides
spectra
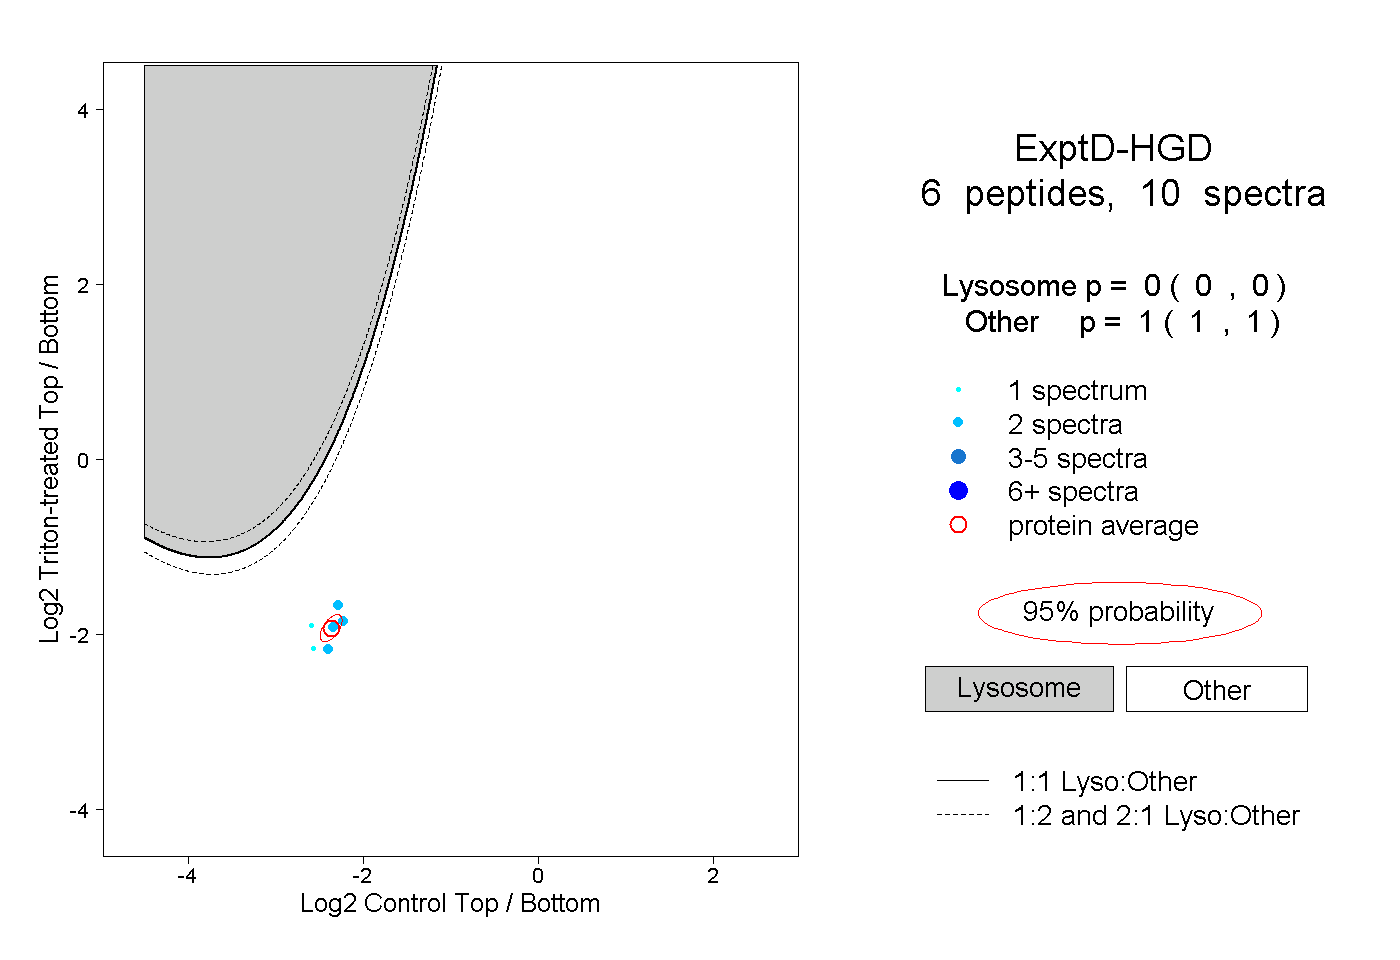
0.000 | 0.000
1.000 | 1.000