 10
10peptides
spectra
0.000 | 0.000
0.000 | 0.010
0.009 | 0.036
0.126 | 0.157
0.000 | 0.002
0.291 | 0.328
0.509 | 0.528
0.000 | 0.000
| Plot | Mito | Lyso | Perox | ER | Golgi | PM | Cytosol | Nucleus | |||||
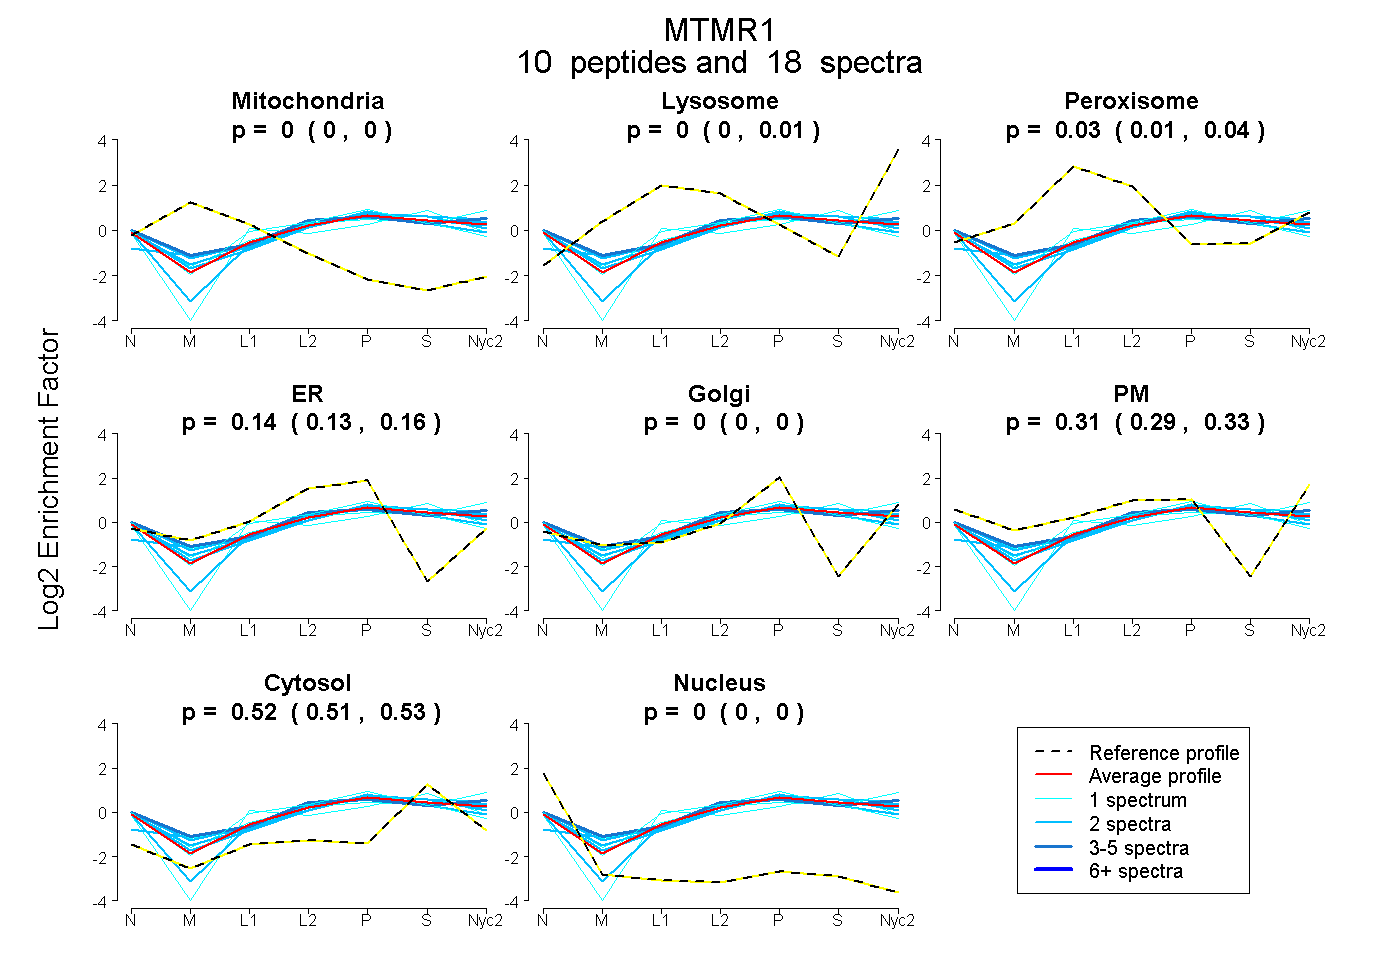
| Expt A |
10 peptides |
18 spectra |
|
0.000 0.000 | 0.000 |
0.000 0.000 | 0.010 |
0.025 0.009 | 0.036 |
0.142 0.126 | 0.157 |
0.000 0.000 | 0.002 |
0.313 0.291 | 0.328 |
0.520 0.509 | 0.528 |
0.000 0.000 | 0.000 |
| 1 spectrum, VGHGDDNHADADR | 0.000 | 0.000 | 0.073 | 0.234 | 0.000 | 0.197 | 0.497 | 0.000 | ||
| 2 spectra, VAGGASGSSR | 0.000 | 0.000 | 0.000 | 0.063 | 0.117 | 0.241 | 0.579 | 0.000 | ||
| 4 spectra, VLLAGAVR | 0.000 | 0.016 | 0.052 | 0.052 | 0.000 | 0.433 | 0.448 | 0.000 | ||
| 2 spectra, MRPQMPIHQNLK | 0.000 | 0.145 | 0.003 | 0.259 | 0.077 | 0.000 | 0.516 | 0.000 | ||
| 1 spectrum, DDDLLK | 0.000 | 0.000 | 0.039 | 0.177 | 0.000 | 0.085 | 0.699 | 0.000 | ||
| 1 spectrum, ELLAVK | 0.000 | 0.000 | 0.058 | 0.069 | 0.084 | 0.328 | 0.461 | 0.000 | ||
| 1 spectrum, VPVLSWIHPESQATITR | 0.000 | 0.079 | 0.036 | 0.029 | 0.068 | 0.363 | 0.426 | 0.000 | ||
| 2 spectra, TIPGFEALIEK | 0.000 | 0.000 | 0.000 | 0.222 | 0.064 | 0.203 | 0.510 | 0.000 | ||
| 2 spectra, QGLPNESWK | 0.000 | 0.000 | 0.050 | 0.066 | 0.000 | 0.411 | 0.473 | 0.000 | ||
| 2 spectra, LTIFDAR | 0.000 | 0.000 | 0.021 | 0.141 | 0.000 | 0.326 | 0.511 | 0.000 |
| Plot | Mito | Lyso or Perox | ER | Golgi | PM | Cytosol | Nucleus | ||||||
| Expt B |
1 peptide |
3 spectra |
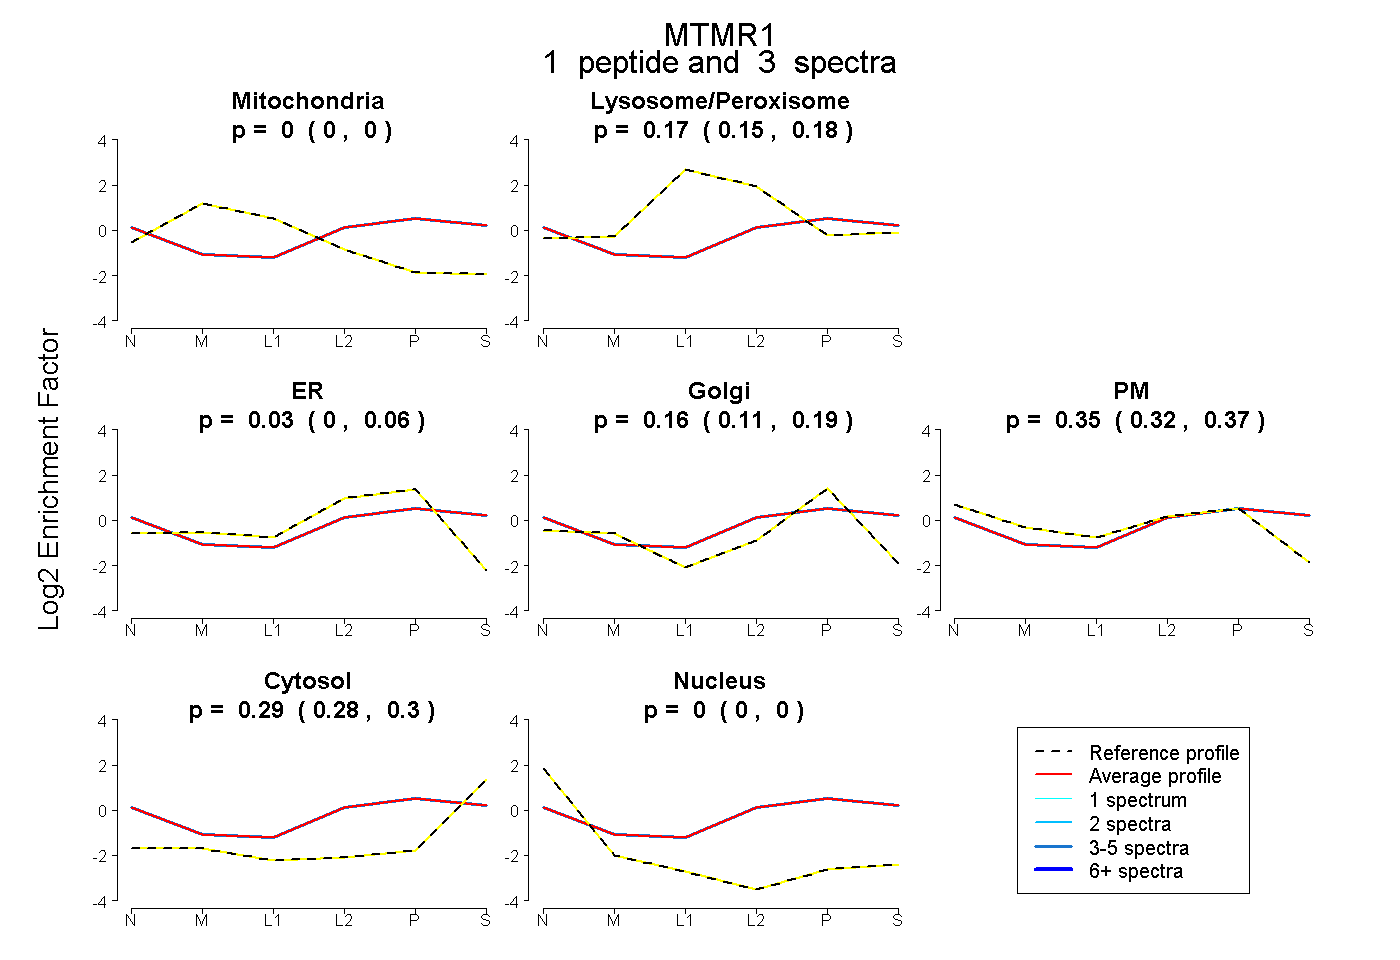 |
0.000 0.000 | 0.000 |
0.170 0.152 | 0.183 |
0.029 0.000 | 0.063 |
0.160 0.115 | 0.193 |
0.350 0.319 | 0.374 |
0.292 0.279 | 0.304 |
0.000 0.000 | 0.000 |
|||
| Plot | Lyso | Other | |||||||||||
| Expt C |
9 peptides |
18 spectra |
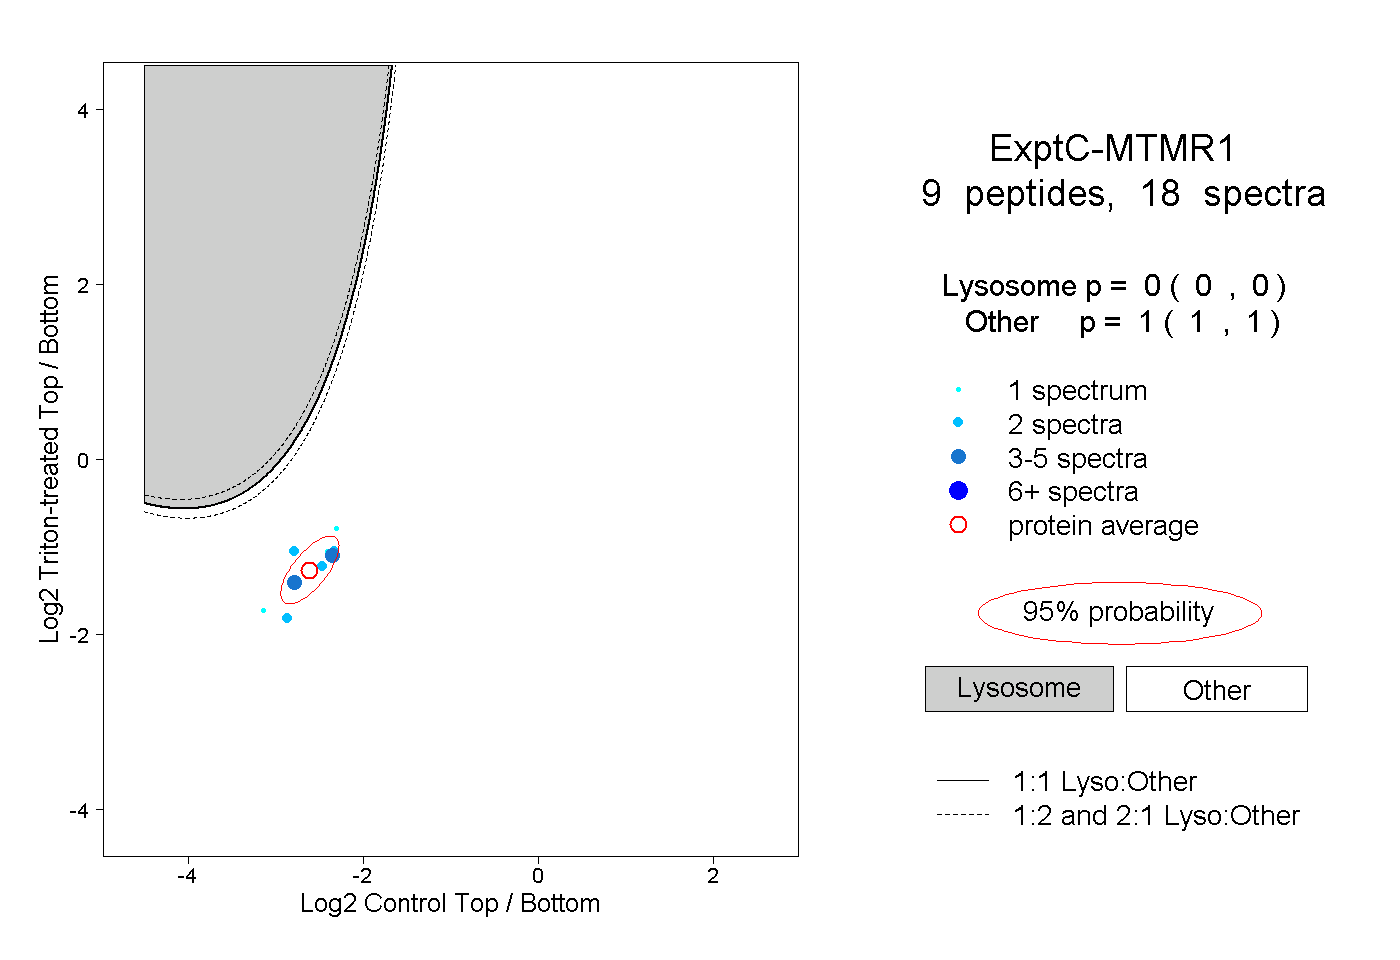 |
0.000 0.000 | 0.000 |
1.000 1.000 | 1.000 |
||||||||
| Plot | Lyso | Other | |||||||||||
| Expt D |
2 peptides |
2 spectra |
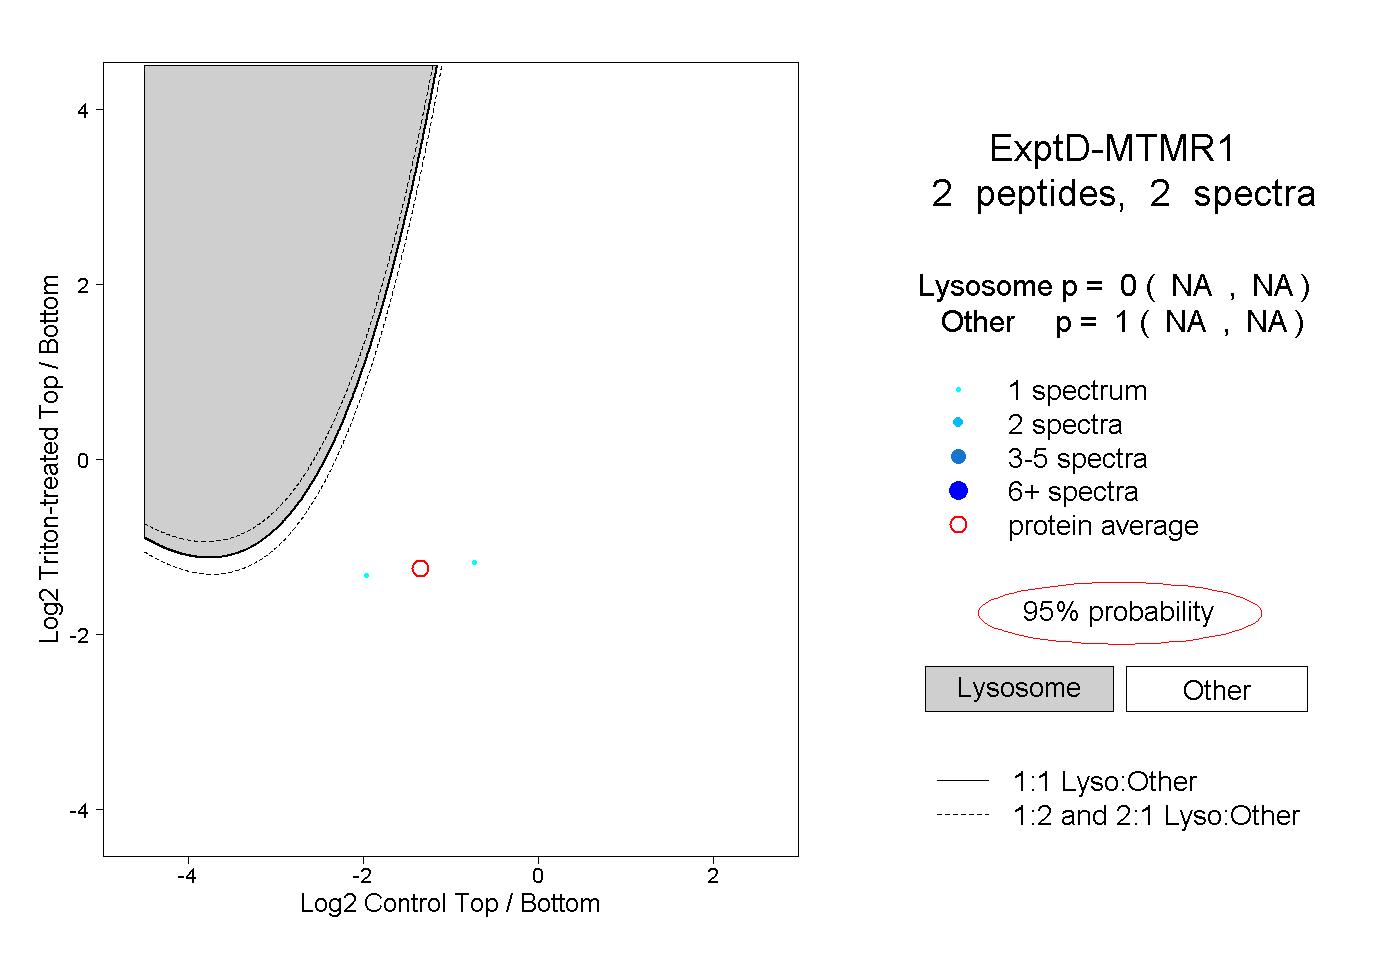 |
0.000 NA | NA |
1.000 NA | NA |