10
10peptides
spectra
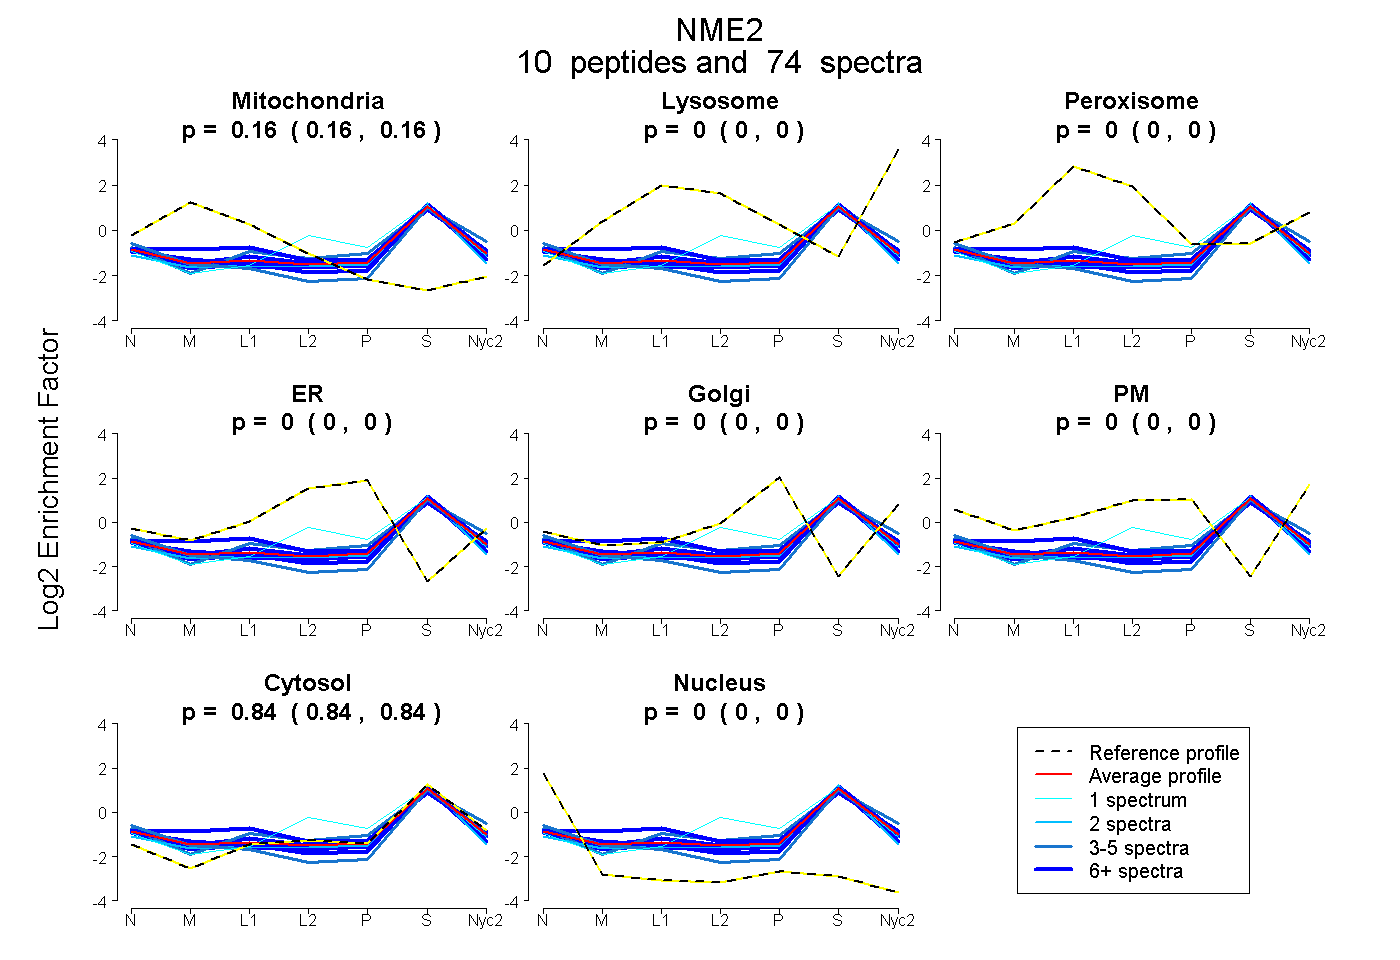
0.158 | 0.164
0.000 | 0.000
0.000 | 0.000
0.000 | 0.000
0.000 | 0.000
0.000 | 0.000
0.835 | 0.841
0.000 | 0.000
8peptides
spectra
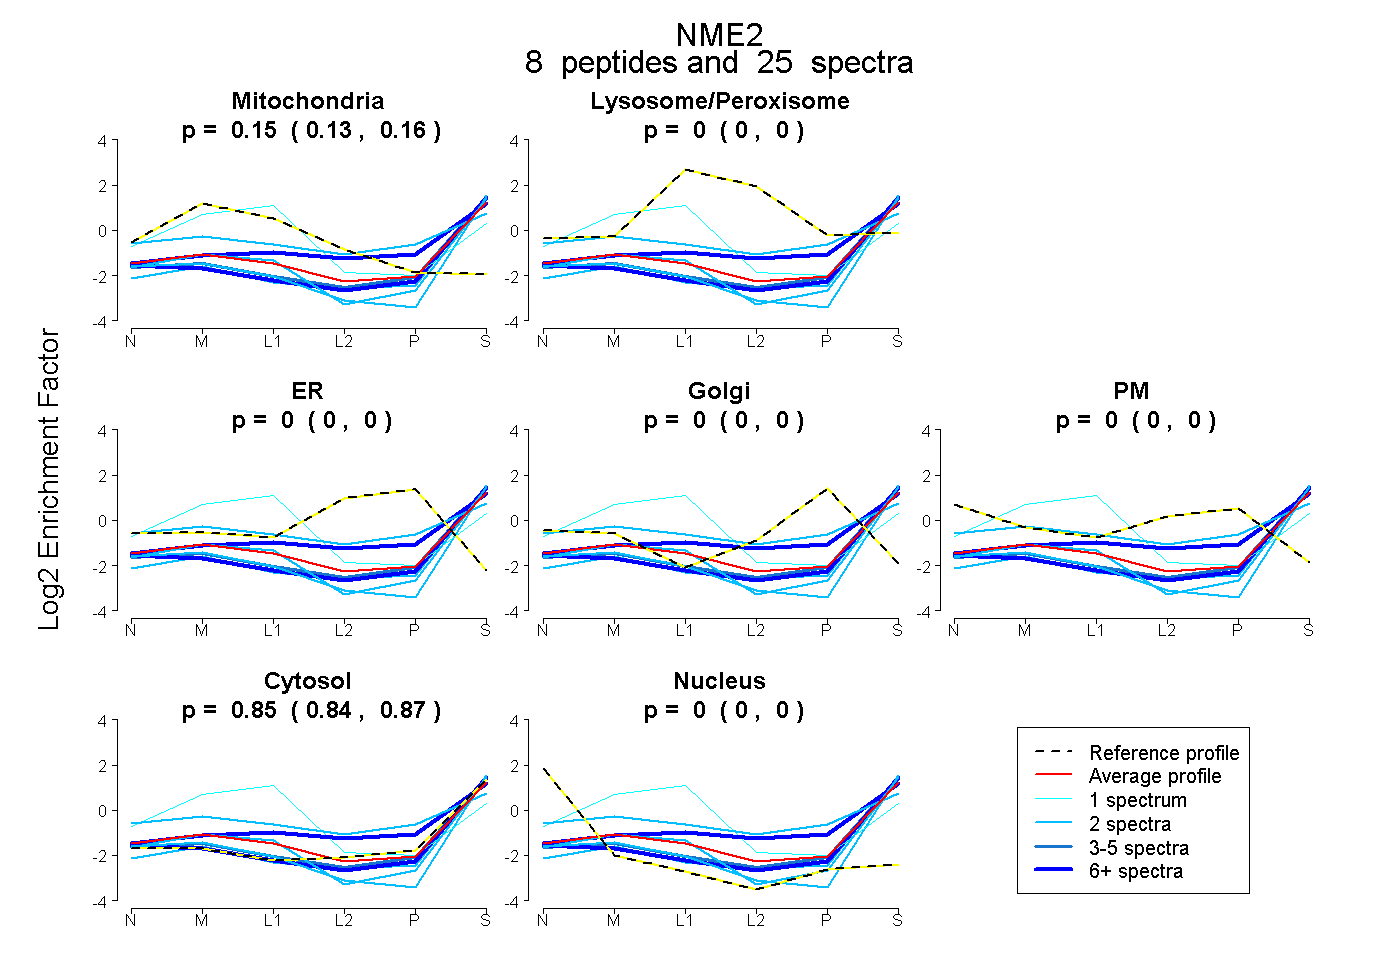
0.130 | 0.161
0.000 | 0.000
0.000 | 0.000
0.000 | 0.000
0.000 | 0.000
0.837 | 0.867
0.000 | 0.000
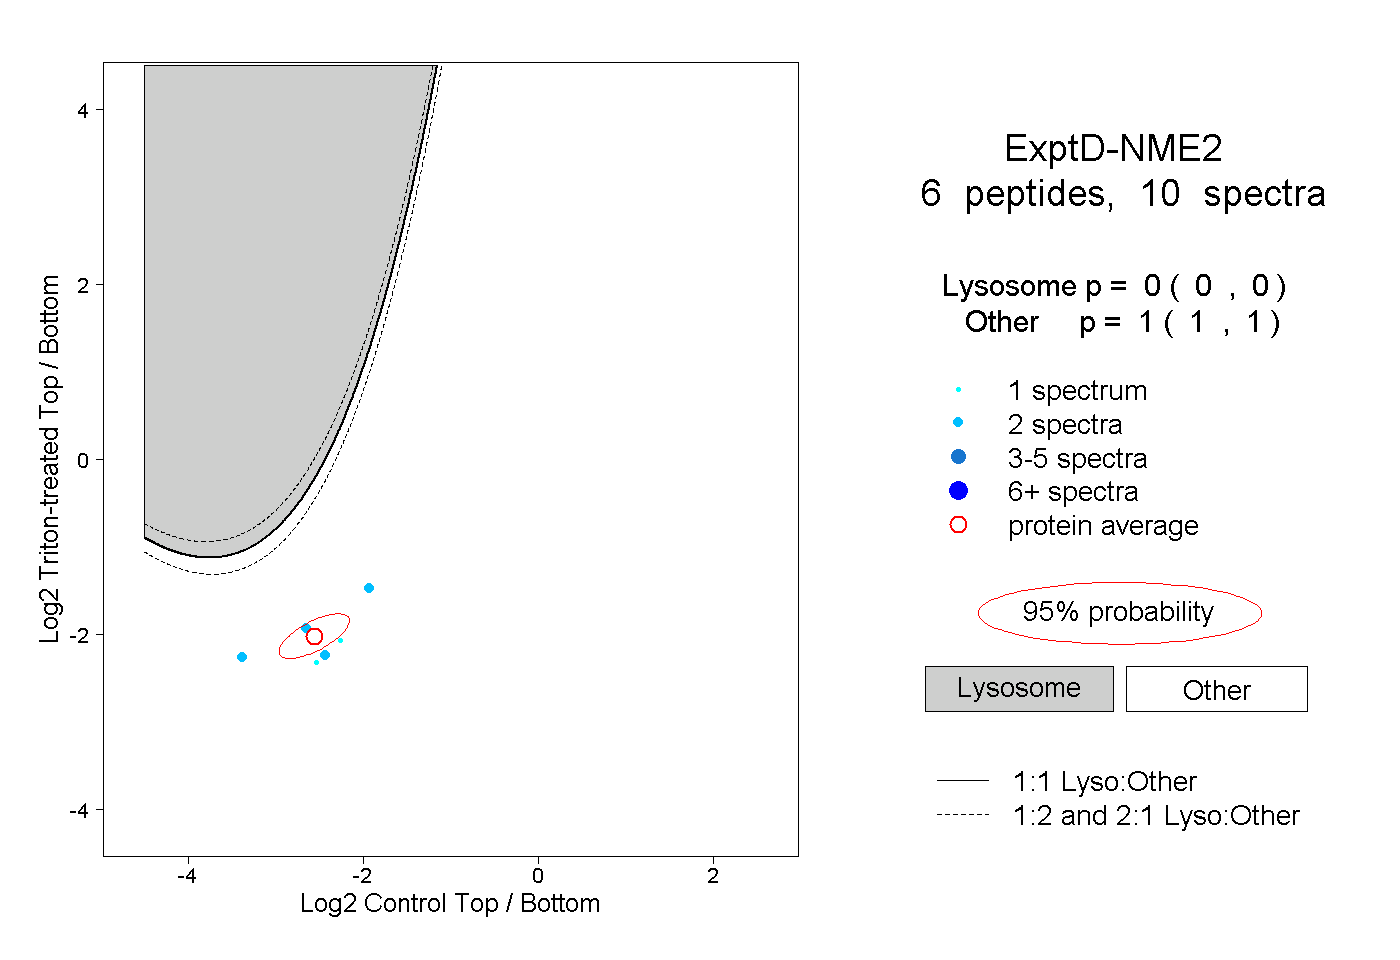
10peptides
spectra
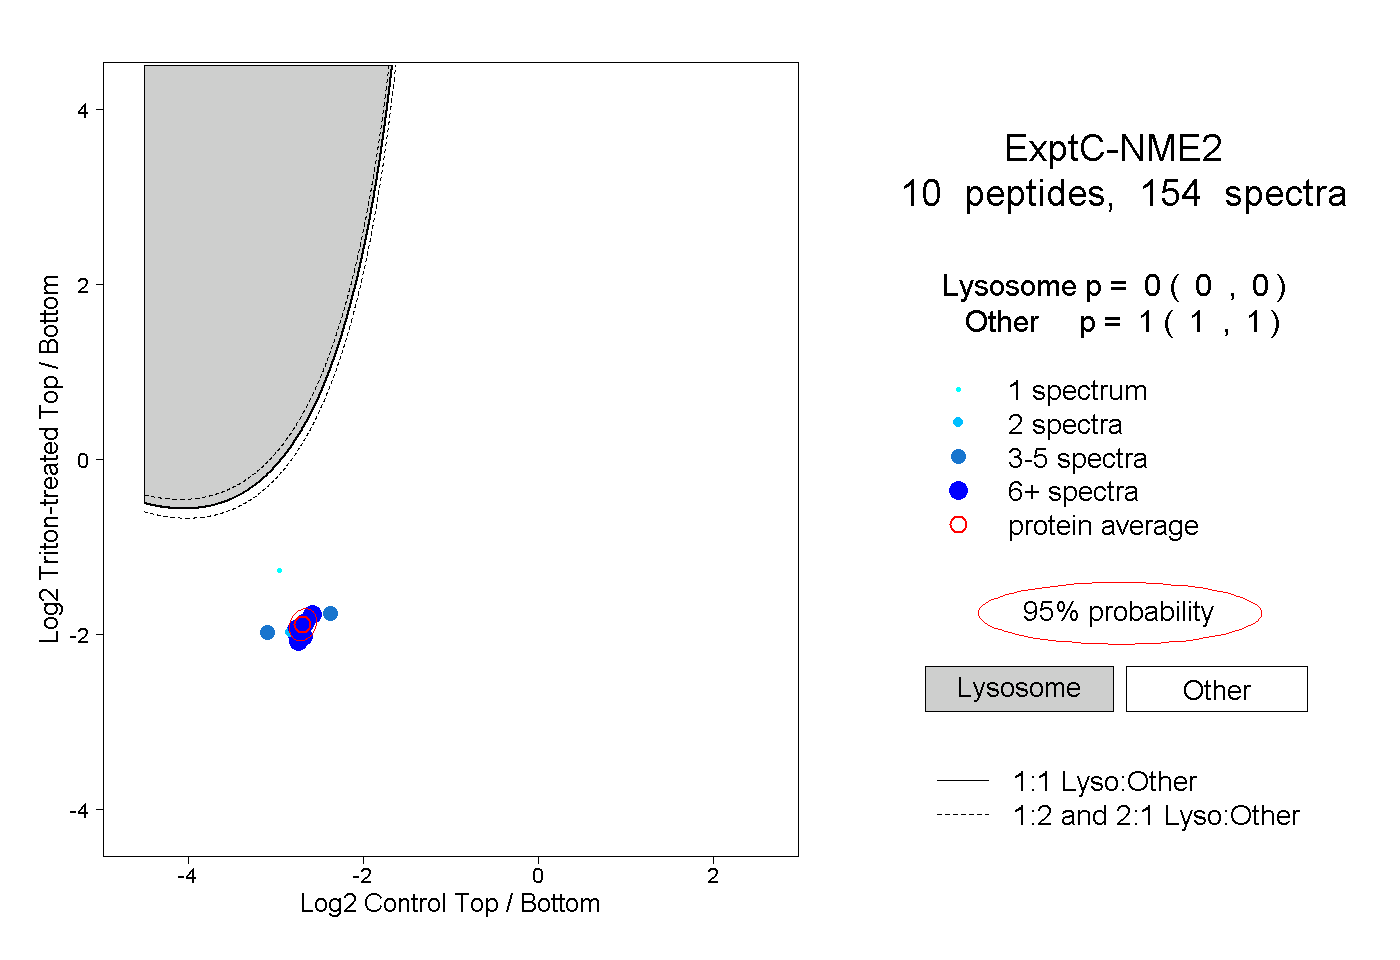
0.000 | 0.000
1.000 | 1.000