 10
10peptides
spectra
0.158 | 0.164
0.000 | 0.000
0.000 | 0.000
0.000 | 0.000
0.000 | 0.000
0.000 | 0.000
0.835 | 0.841
0.000 | 0.000
| Plot | Mito | Lyso | Perox | ER | Golgi | PM | Cytosol | Nucleus | |||||
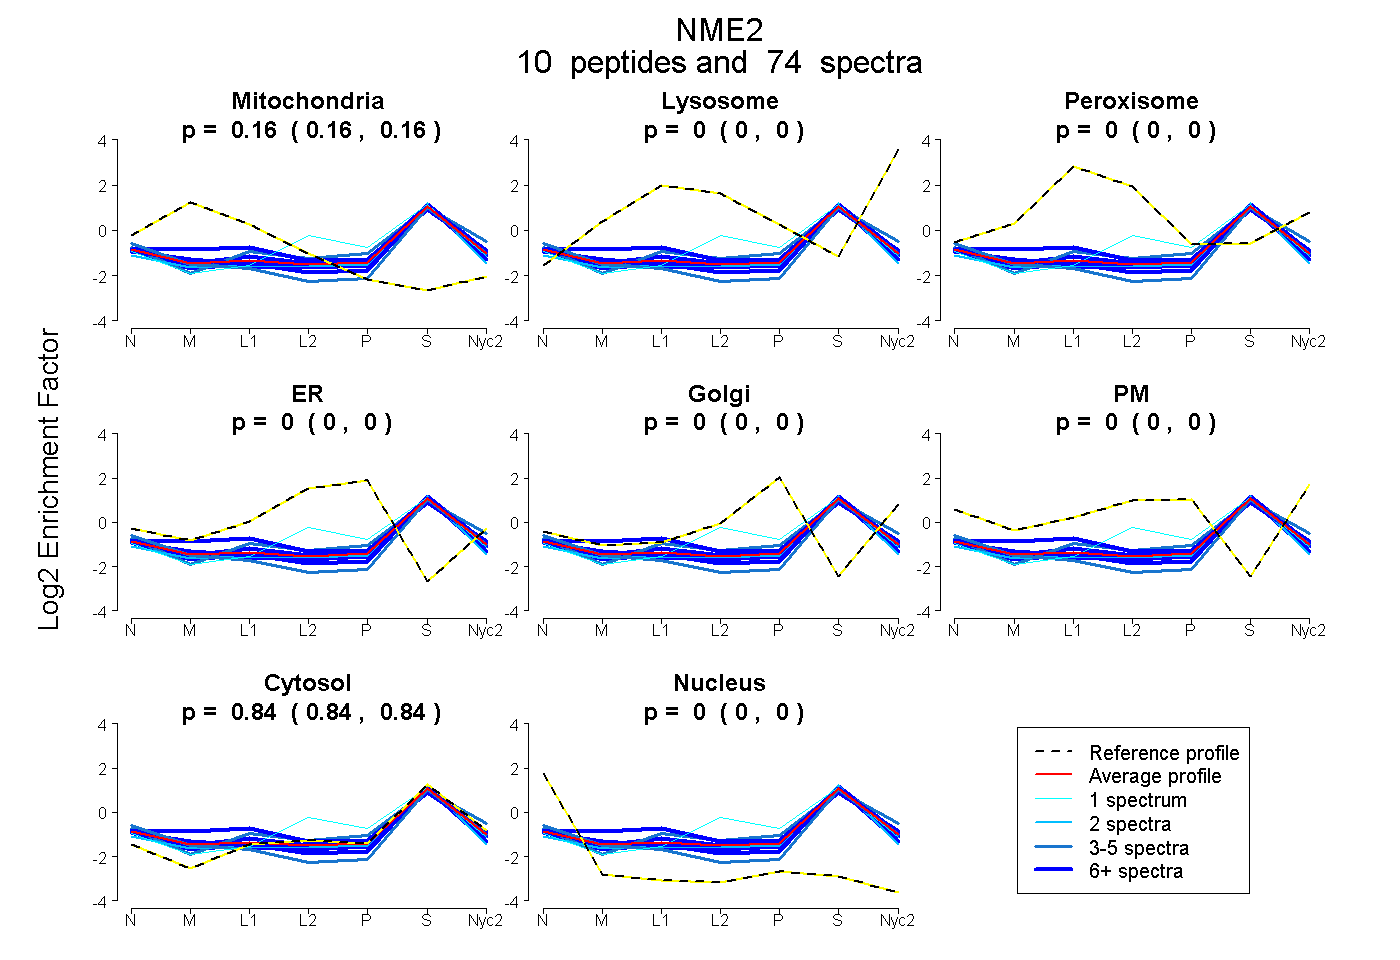
| Expt A |
10 peptides |
74 spectra |
|
0.162 0.158 | 0.164 |
0.000 0.000 | 0.000 |
0.000 0.000 | 0.000 |
0.000 0.000 | 0.000 |
0.000 0.000 | 0.000 |
0.000 0.000 | 0.000 |
0.838 0.835 | 0.841 |
0.000 0.000 | 0.000 |
| 15 spectra, TFIAIKPDGVQR | 0.165 | 0.000 | 0.000 | 0.000 | 0.000 | 0.000 | 0.835 | 0.000 | ||
| 7 spectra, GLVGEIIK | 0.102 | 0.000 | 0.000 | 0.000 | 0.000 | 0.000 | 0.859 | 0.039 | ||
| 8 spectra, GDFCIQVGR | 0.176 | 0.000 | 0.000 | 0.000 | 0.000 | 0.000 | 0.822 | 0.002 | ||
| 1 spectrum, YMNSGPVVAMVWEGLNVVK | 0.000 | 0.000 | 0.000 | 0.167 | 0.000 | 0.000 | 0.833 | 0.000 | ||
| 10 spectra, ASEEHLK | 0.148 | 0.000 | 0.000 | 0.000 | 0.000 | 0.000 | 0.844 | 0.008 | ||
| 10 spectra, DRPFFPGLVK | 0.122 | 0.000 | 0.000 | 0.000 | 0.000 | 0.000 | 0.839 | 0.039 | ||
| 14 spectra, SCAHDWVYE | 0.210 | 0.000 | 0.086 | 0.000 | 0.000 | 0.000 | 0.704 | 0.000 | ||
| 2 spectra, QHYIDLK | 0.112 | 0.000 | 0.000 | 0.000 | 0.000 | 0.000 | 0.854 | 0.035 | ||
| 4 spectra, NIIHGSDSVESAEK | 0.018 | 0.000 | 0.048 | 0.000 | 0.000 | 0.095 | 0.828 | 0.011 | ||
| 3 spectra, VMLGETNPADSKPGTIR | 0.099 | 0.000 | 0.000 | 0.000 | 0.000 | 0.000 | 0.784 | 0.117 |
| Plot | Mito | Lyso or Perox | ER | Golgi | PM | Cytosol | Nucleus | ||||||
| Expt B |
8 peptides |
25 spectra |
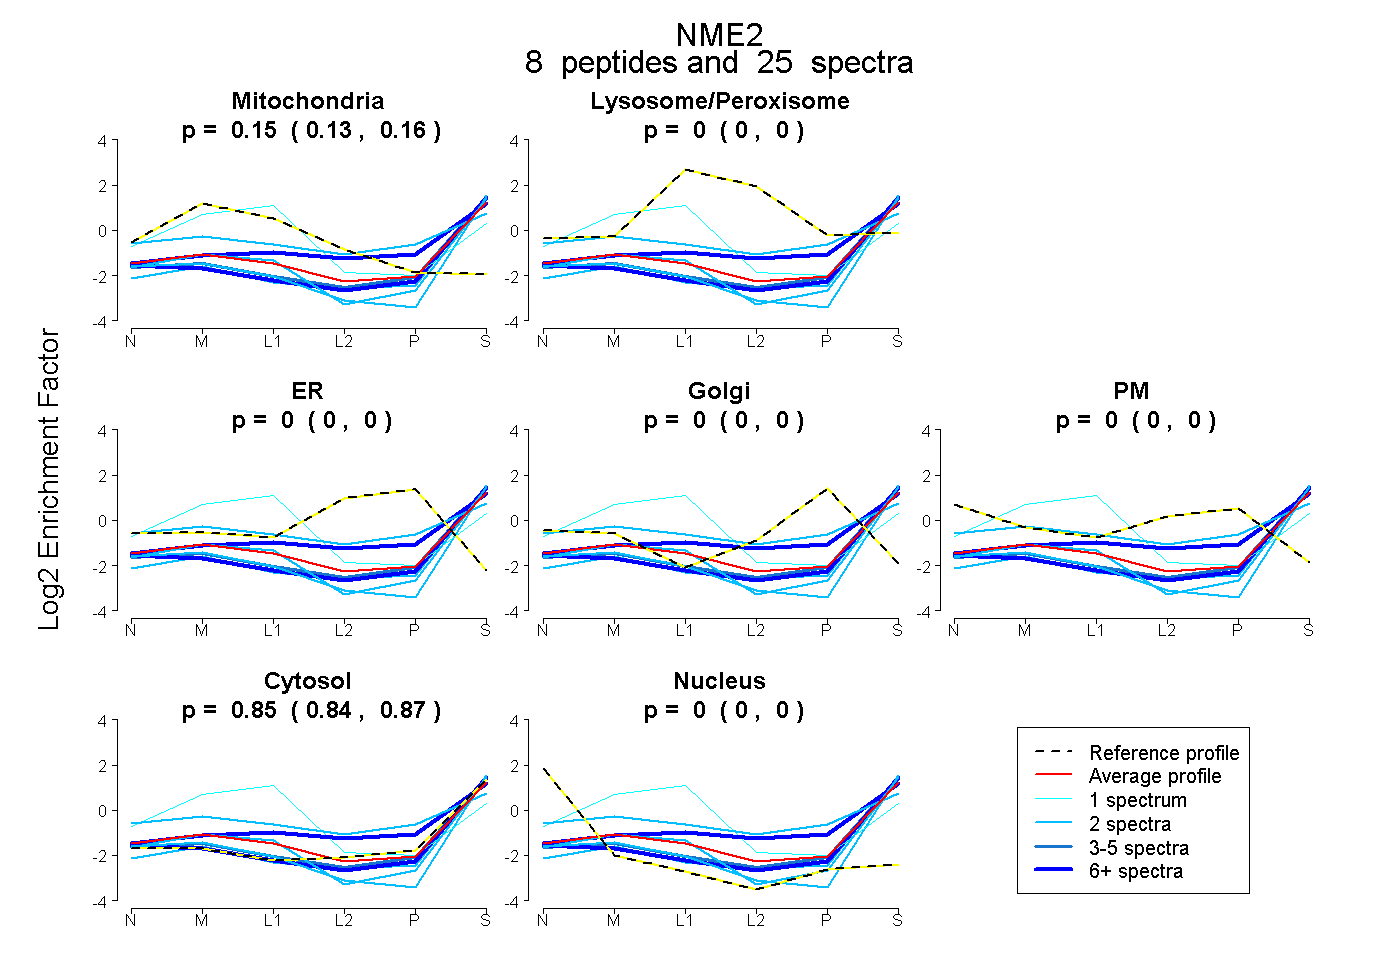 |
0.147 0.130 | 0.161 |
0.000 0.000 | 0.000 |
0.000 0.000 | 0.000 |
0.000 0.000 | 0.000 |
0.000 0.000 | 0.000 |
0.853 0.837 | 0.867 |
0.000 0.000 | 0.000 |
|||
| Plot | Lyso | Other | |||||||||||
| Expt C |
10 peptides |
154 spectra |
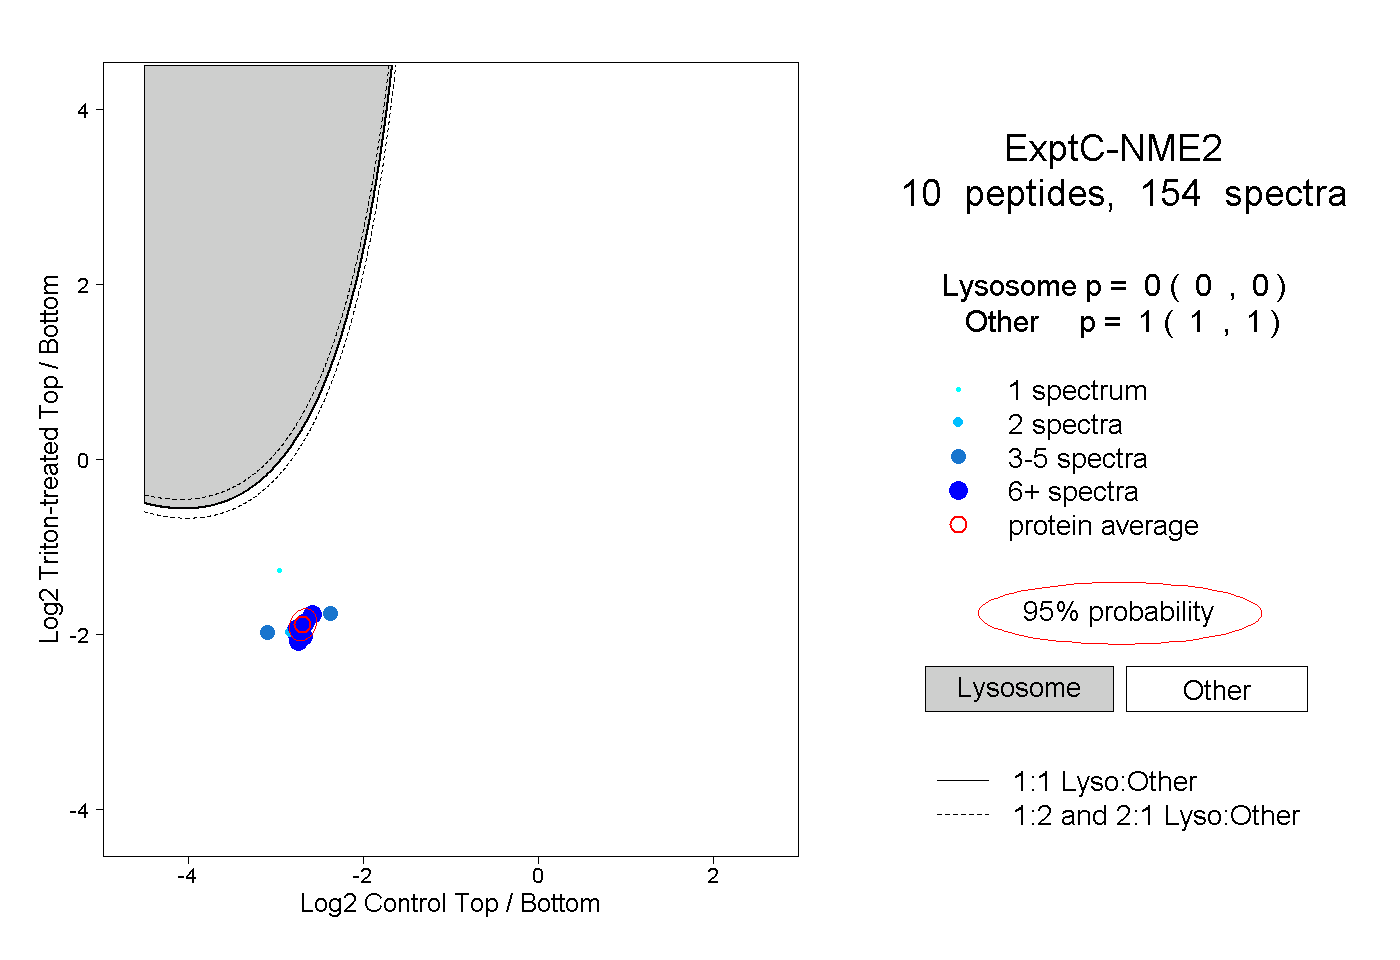 |
0.000 0.000 | 0.000 |
1.000 1.000 | 1.000 |
||||||||
| Plot | Lyso | Other | |||||||||||
| Expt D |
6 peptides |
10 spectra |
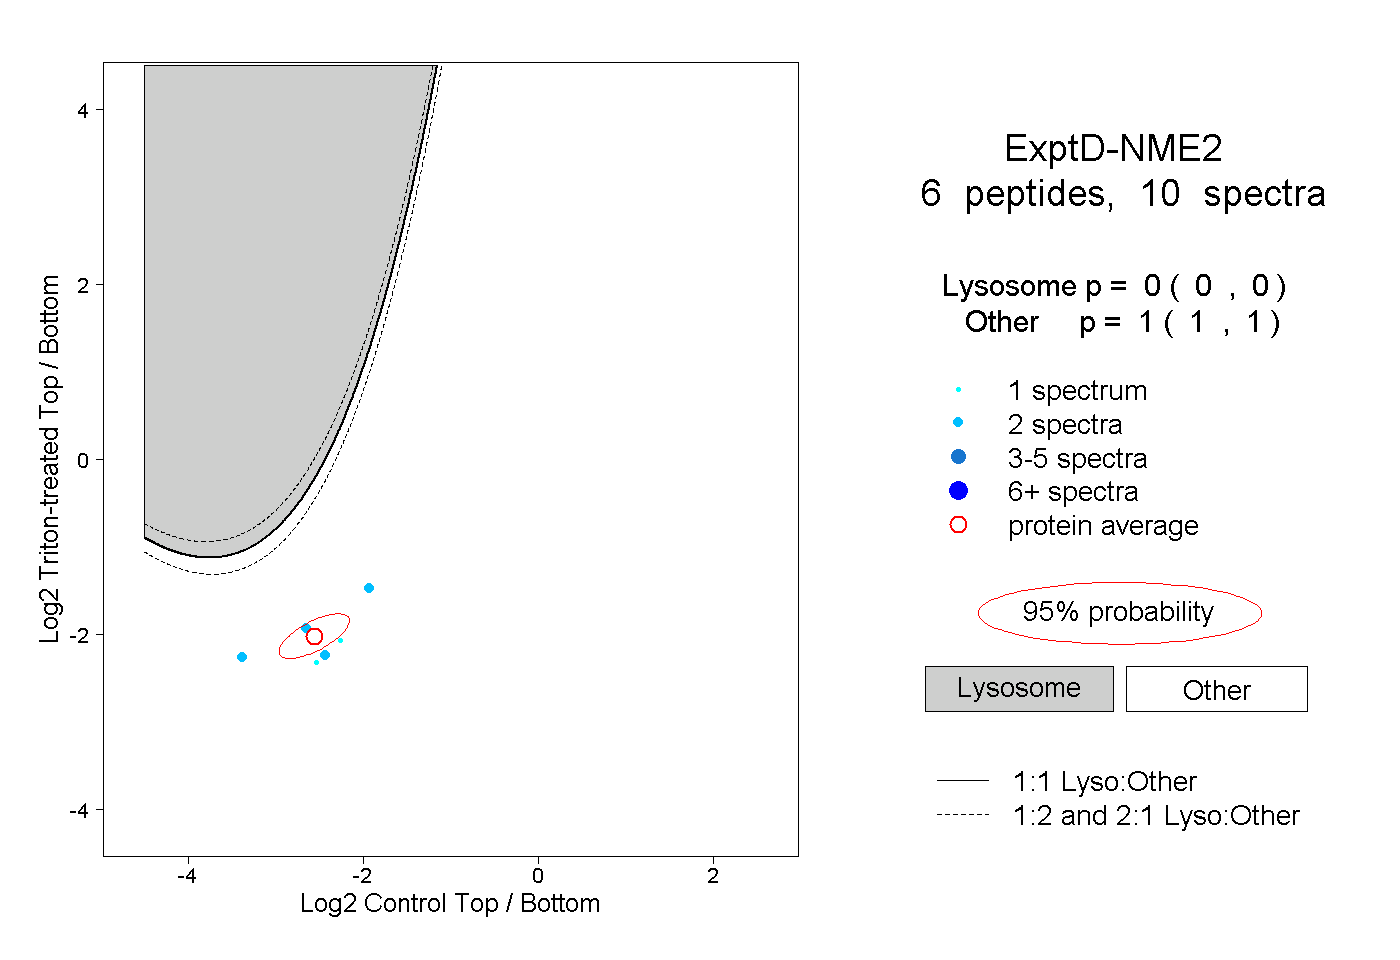 |
0.000 0.000 | 0.000 |
1.000 1.000 | 1.000 |