 6
6peptides
spectra
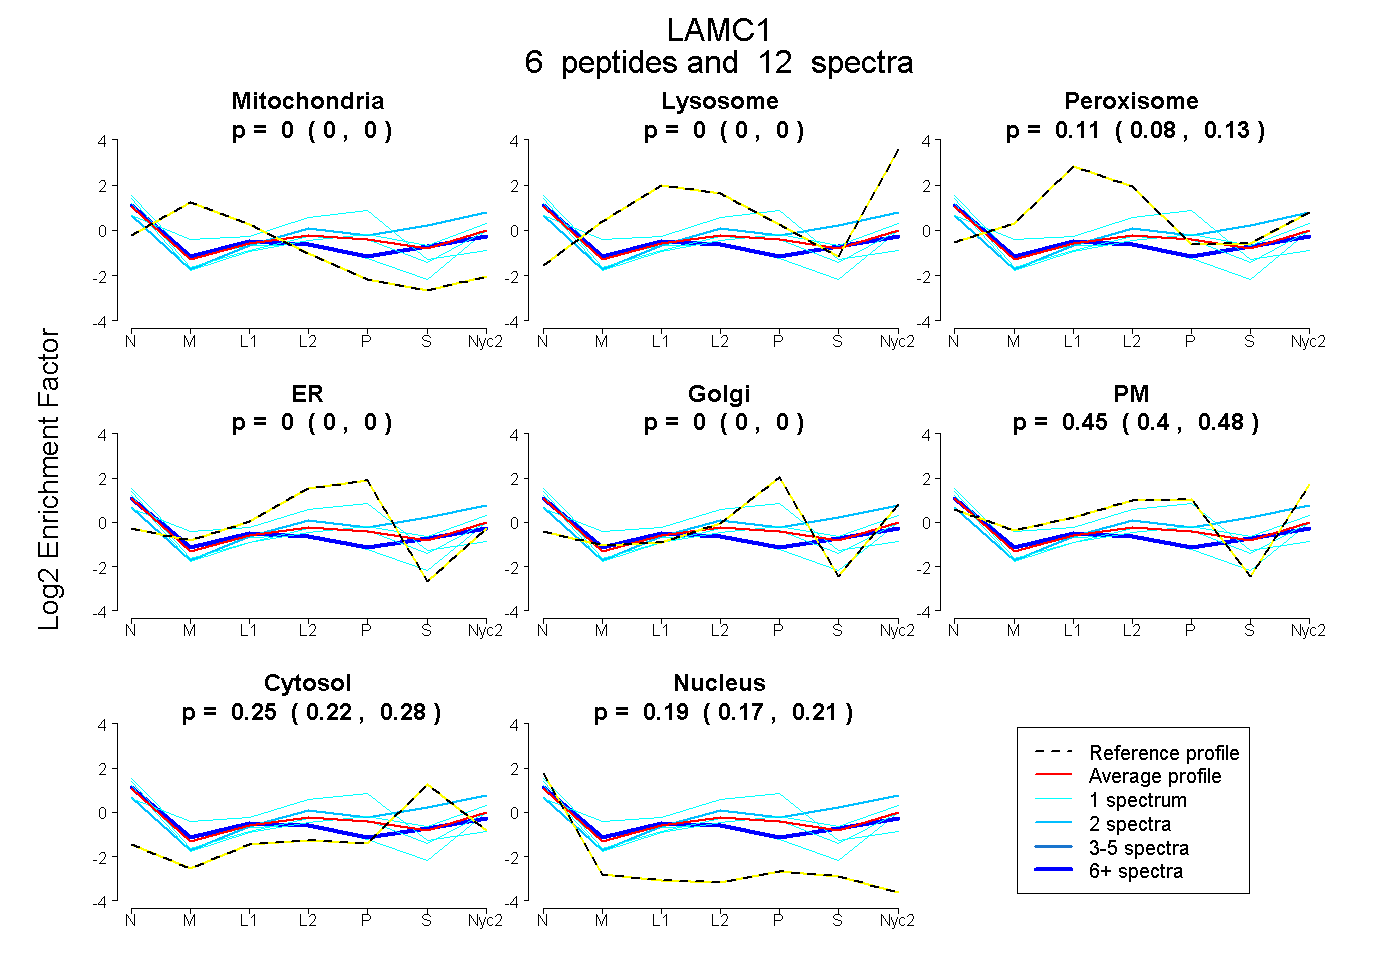
0.000 | 0.000
0.000 | 0.000
0.075 | 0.134
0.000 | 0.000
0.000 | 0.000
0.405 | 0.482
0.223 | 0.278
0.168 | 0.212
| Plot | Mito | Lyso | Perox | ER | Golgi | PM | Cytosol | Nucleus | |||||
| Expt A |
6 peptides |
12 spectra |
|
0.000 0.000 | 0.000 |
0.000 0.000 | 0.000 |
0.108 0.075 | 0.134 |
0.000 0.000 | 0.000 |
0.000 0.000 | 0.000 |
0.447 0.405 | 0.482 |
0.253 0.223 | 0.278 |
0.192 0.168 | 0.212 |
| 1 spectrum, AFDITYVR | 0.000 | 0.066 | 0.118 | 0.000 | 0.000 | 0.402 | 0.000 | 0.414 | ||
| 1 spectrum, NTIEETGILAER | 0.041 | 0.000 | 0.139 | 0.527 | 0.000 | 0.066 | 0.100 | 0.125 | ||
| 2 spectra, EAQEVK | 0.000 | 0.000 | 0.003 | 0.000 | 0.000 | 0.490 | 0.507 | 0.000 | ||
| 1 spectrum, TIAEANEK | 0.000 | 0.000 | 0.000 | 0.000 | 0.000 | 0.515 | 0.327 | 0.158 | ||
| 1 spectrum, TAAEEALR | 0.000 | 0.000 | 0.012 | 0.000 | 0.000 | 0.560 | 0.168 | 0.261 | ||
| 6 spectra, ALAEEAAK | 0.000 | 0.000 | 0.253 | 0.000 | 0.000 | 0.245 | 0.213 | 0.288 |
| Plot | Lyso | Other | |||||||||||
| Expt C |
10 peptides |
18 spectra |
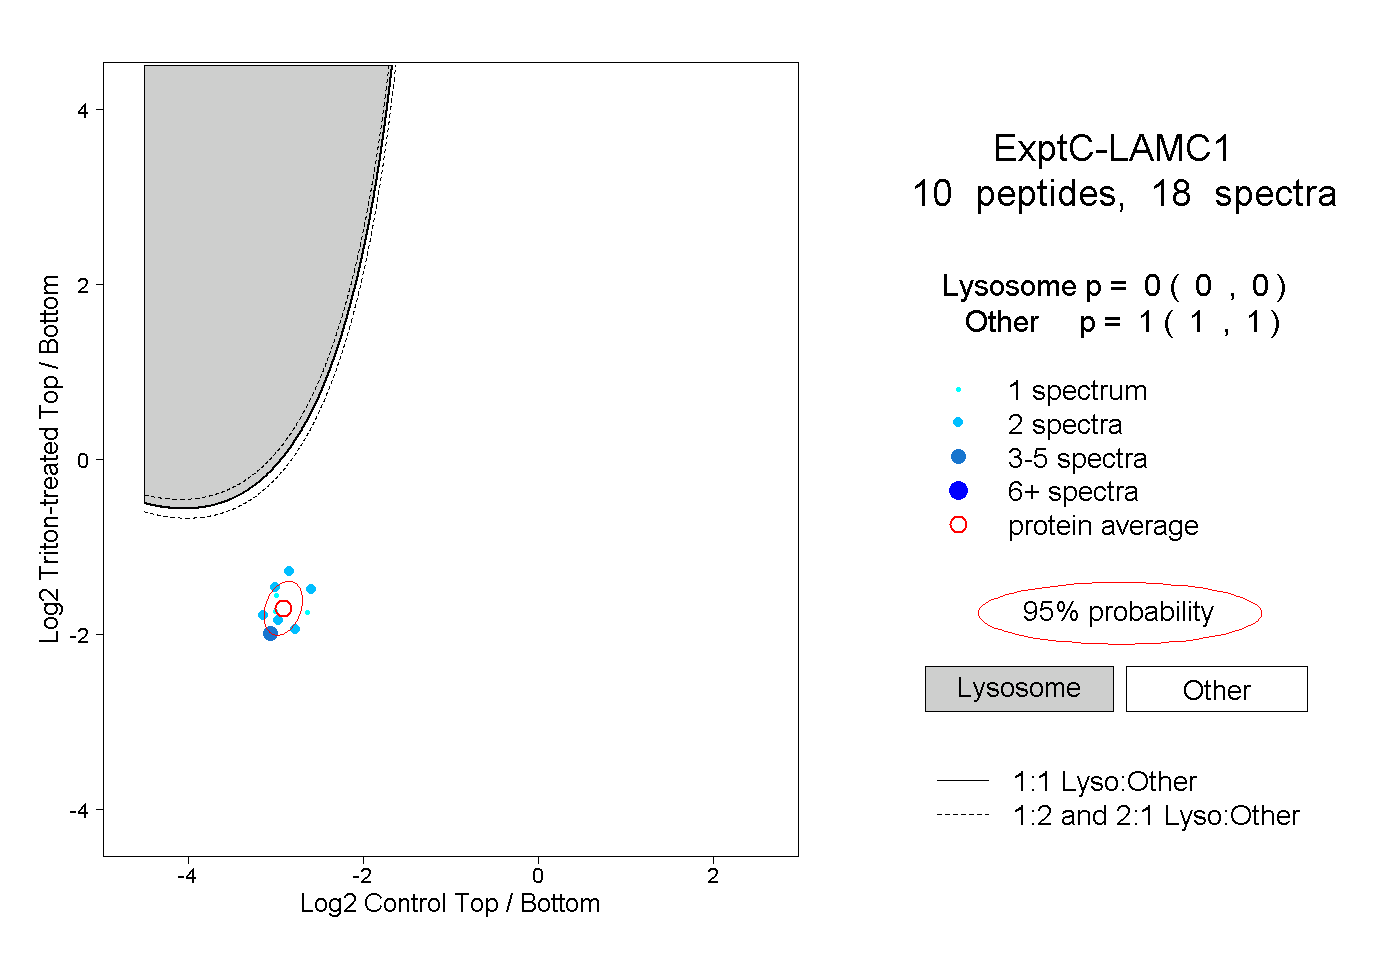 |
0.000 0.000 | 0.000 |
1.000 1.000 | 1.000 |