 3
3peptides
spectra
0.000 | 0.279
0.000 | 0.097
0.000 | 0.130
0.000 | 0.328
0.000 | 0.377
0.000 | 0.431
0.167 | 0.556
0.000 | 0.133
2peptides
spectra
0.000 | 0.000
1.000 | 1.000
| Plot | Mito | Lyso | Perox | ER | Golgi | PM | Cytosol | Nucleus | |||||
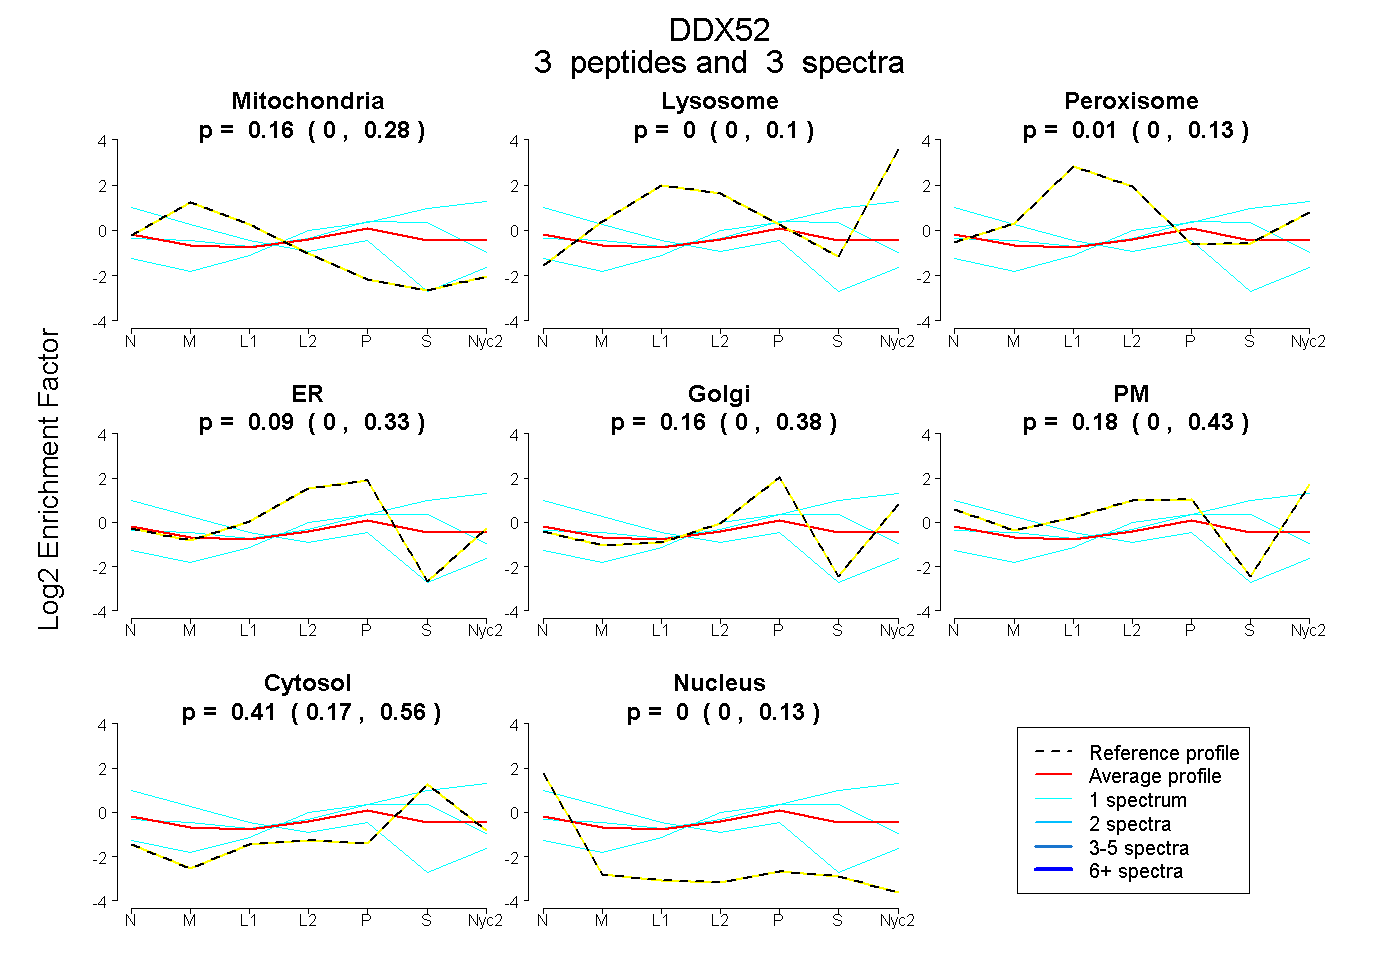
| Expt A |
3 peptides |
3 spectra |
|
0.161 0.000 | 0.279 |
0.000 0.000 | 0.097 |
0.009 0.000 | 0.130 |
0.085 0.000 | 0.328 |
0.161 0.000 | 0.377 |
0.177 0.000 | 0.431 |
0.408 0.167 | 0.556 |
0.000 0.000 | 0.133 |
||
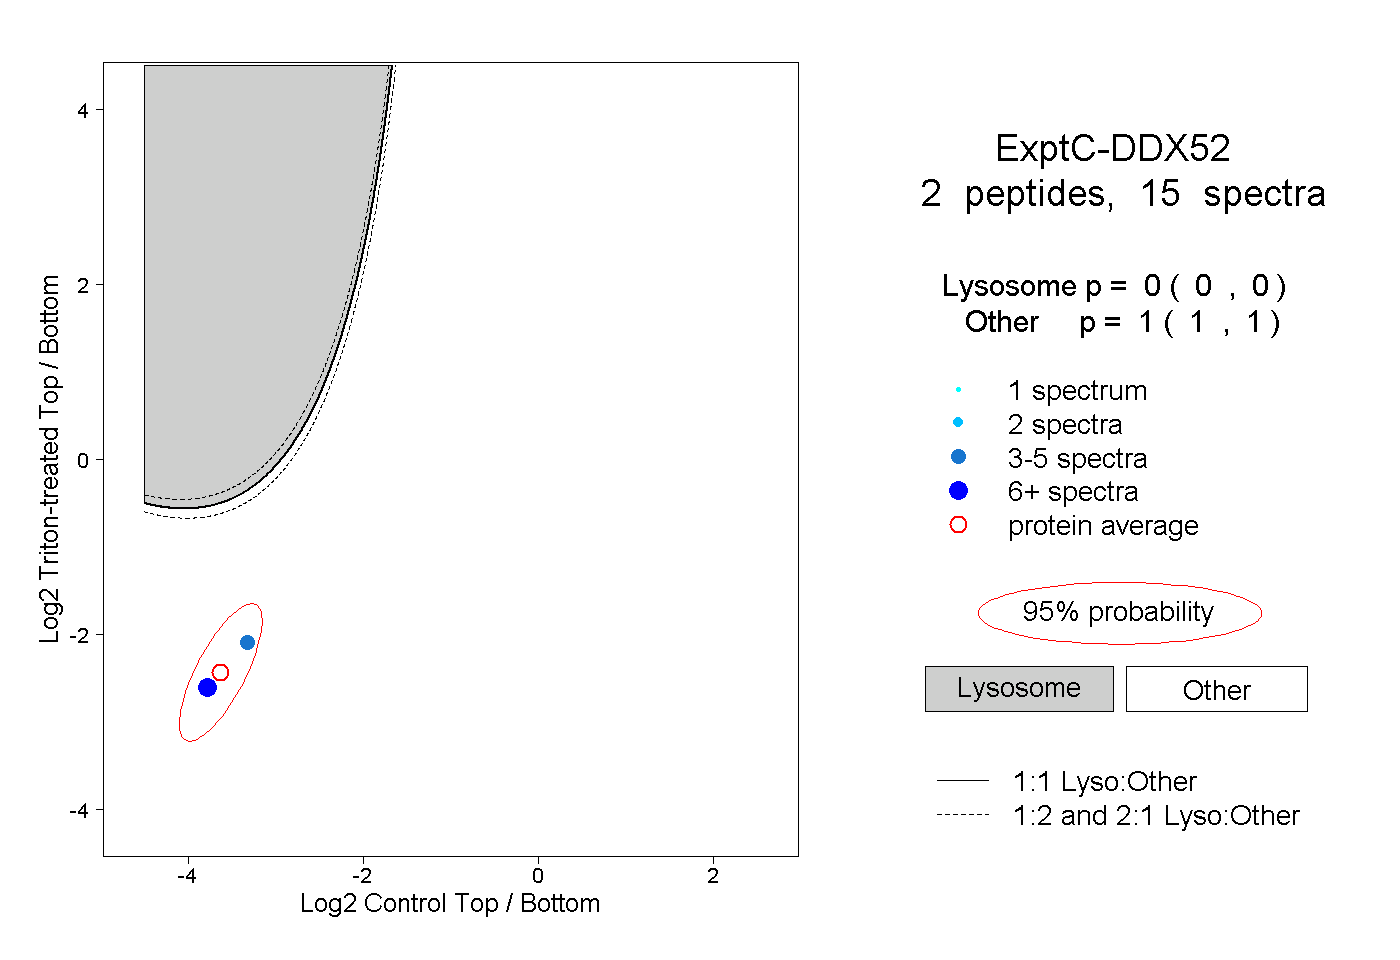
| Plot | Lyso | Other | |||||||||||
| Expt C |
2 peptides |
15 spectra |
|
0.000 0.000 | 0.000 |
1.000 1.000 | 1.000 |