 2
2peptides
spectra
0.000 | 0.000
0.000 | 0.000
0.000 | 0.000
0.146 | 0.203
0.000 | 0.000
0.000 | 0.000
0.246 | 0.291
0.522 | 0.577
1peptide
spectra
NA | NA
NA | NA
NA | NA
NA | NA
NA | NA
NA | NA
NA | NA
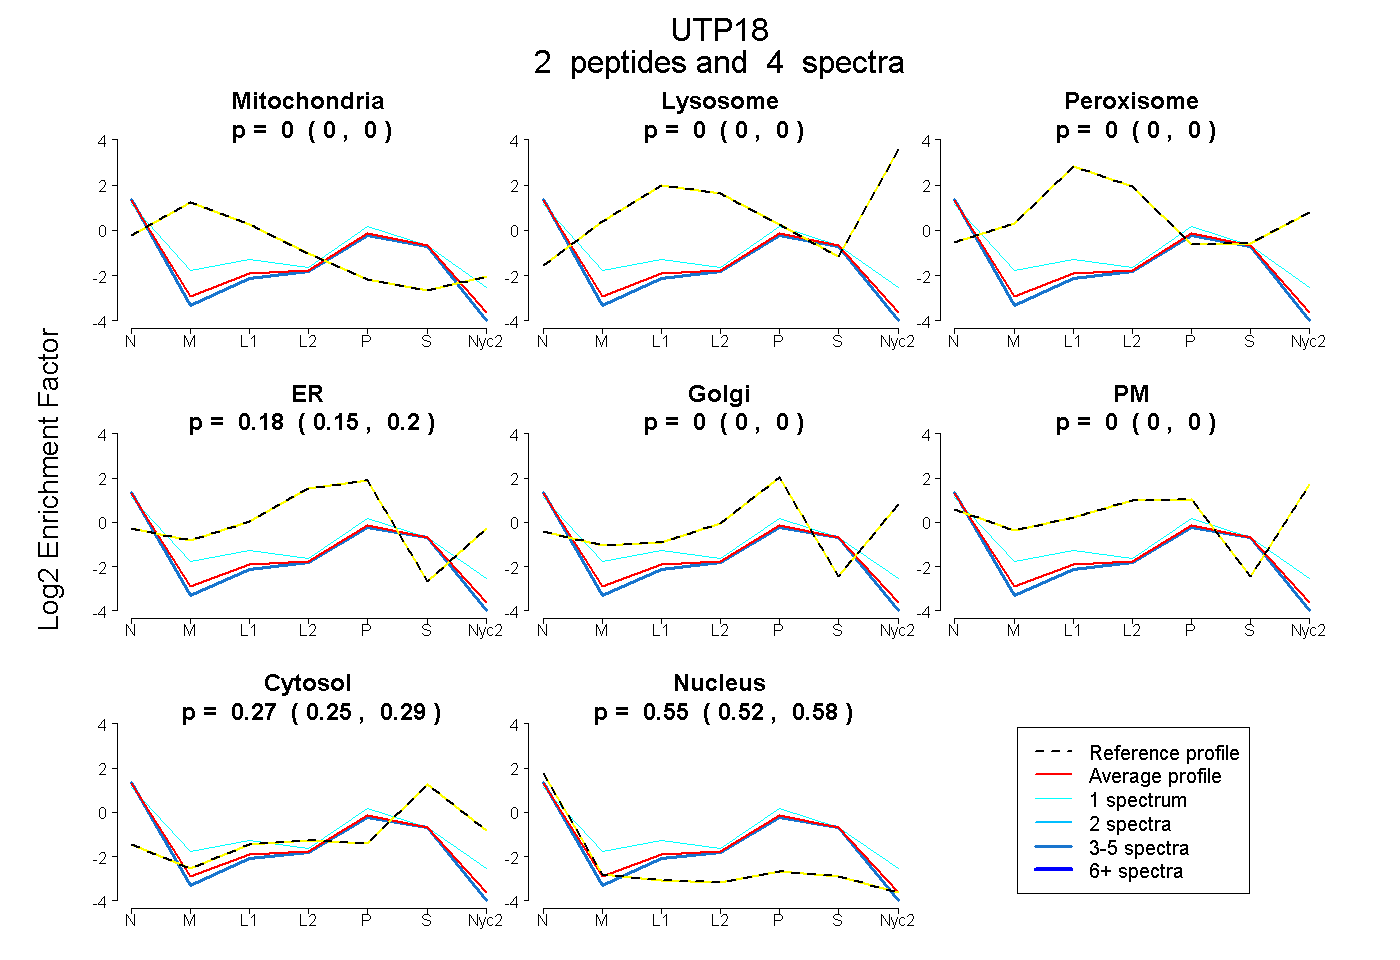
| Plot | Mito | Lyso | Perox | ER | Golgi | PM | Cytosol | Nucleus | |||||
| Expt A |
2 peptides |
4 spectra |
|
0.000 0.000 | 0.000 |
0.000 0.000 | 0.000 |
0.000 0.000 | 0.000 |
0.178 0.146 | 0.203 |
0.000 0.000 | 0.000 |
0.000 0.000 | 0.000 |
0.271 0.246 | 0.291 |
0.551 0.522 | 0.577 |
||
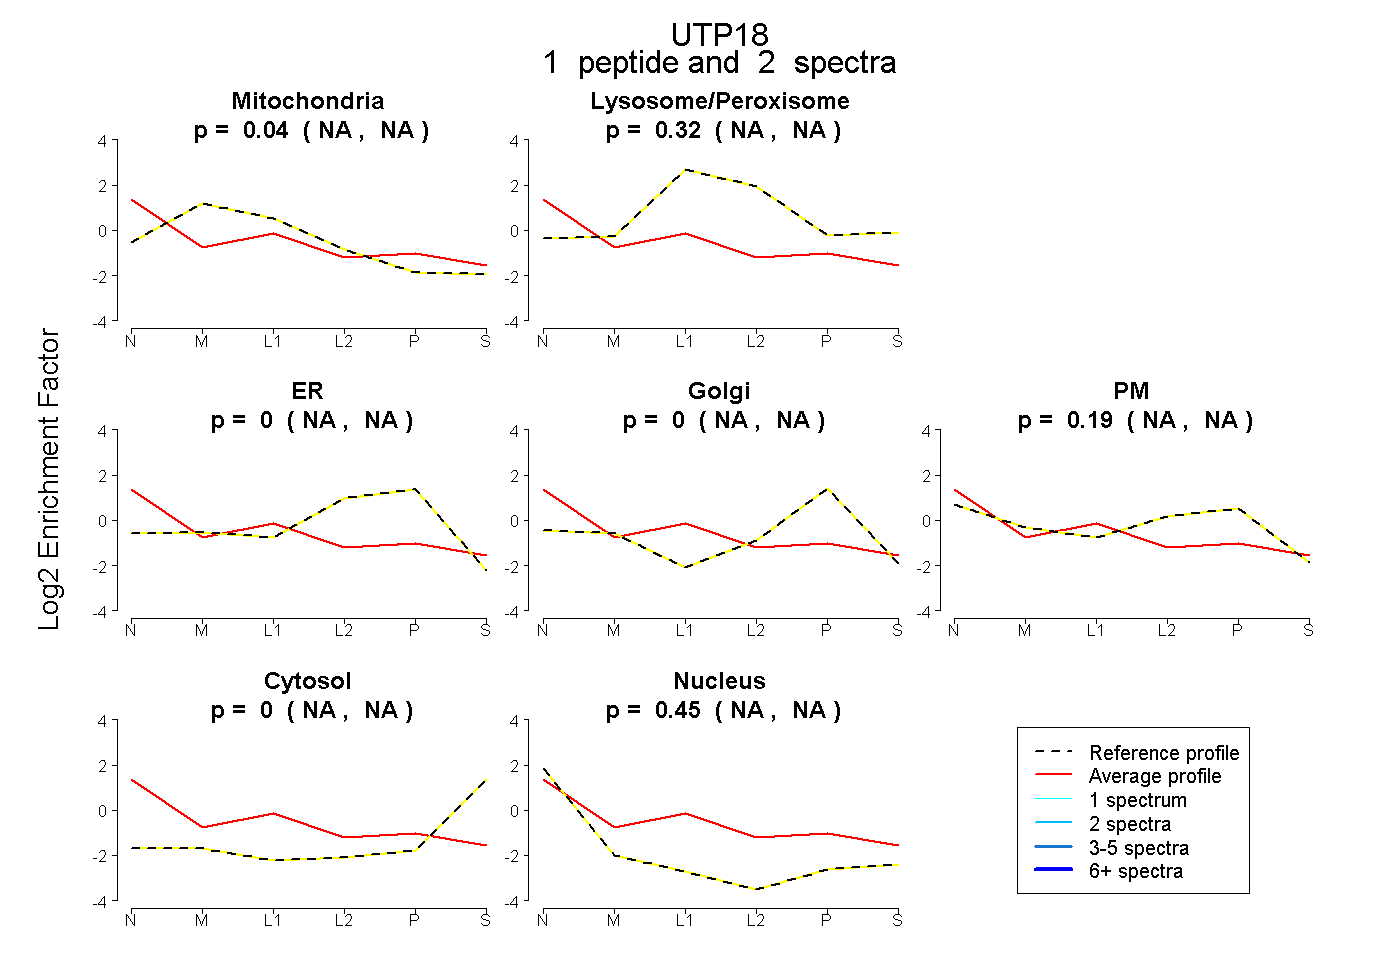
| Plot | Mito | Lyso or Perox | ER | Golgi | PM | Cytosol | Nucleus | ||||||
| Expt B |
1 peptide |
2 spectra |
|
0.038 NA | NA |
0.325 NA | NA |
0.000 NA | NA |
0.000 NA | NA |
0.189 NA | NA |
0.000 NA | NA |
0.448 NA | NA |