 5
5peptides
spectra
0.021 | 0.070
0.063 | 0.103
0.000 | 0.003
0.000 | 0.000
0.000 | 0.013
0.000 | 0.000
0.837 | 0.886
0.000 | 0.000
| Plot | Mito | Lyso | Perox | ER | Golgi | PM | Cytosol | Nucleus | |||||
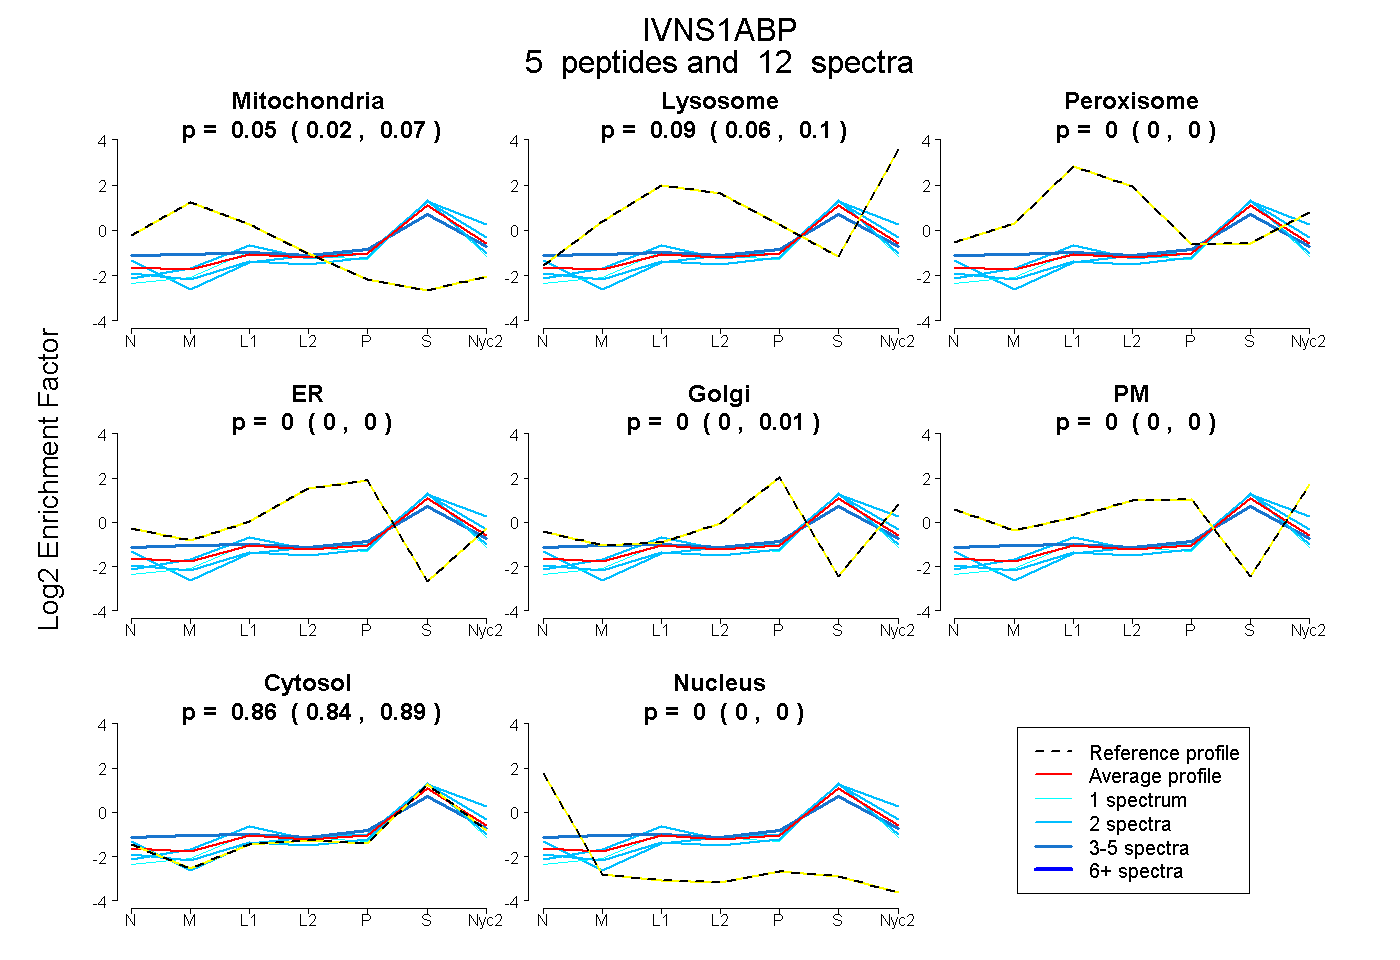
| Expt A |
5 peptides |
12 spectra |
|
0.048 0.021 | 0.070 |
0.088 0.063 | 0.103 |
0.000 0.000 | 0.003 |
0.000 0.000 | 0.000 |
0.000 0.000 | 0.013 |
0.000 0.000 | 0.000 |
0.864 0.837 | 0.886 |
0.000 0.000 | 0.000 |
| 5 spectra, NCDVFDPVTK | 0.161 | 0.053 | 0.015 | 0.000 | 0.064 | 0.000 | 0.707 | 0.000 | ||
| 2 spectra, MMGNMTSPR | 0.000 | 0.192 | 0.000 | 0.000 | 0.000 | 0.000 | 0.808 | 0.000 | ||
| 2 spectra, SWTSCAPLNIR | 0.022 | 0.000 | 0.000 | 0.000 | 0.000 | 0.000 | 0.978 | 0.000 | ||
| 1 spectrum, LYIVGGSDPYGQK | 0.004 | 0.000 | 0.052 | 0.000 | 0.000 | 0.000 | 0.944 | 0.000 | ||
| 2 spectra, LIAAGGYNR | 0.000 | 0.037 | 0.000 | 0.000 | 0.032 | 0.000 | 0.930 | 0.000 |
| Plot | Lyso | Other | |||||||||||
| Expt C |
1 peptide |
2 spectra |
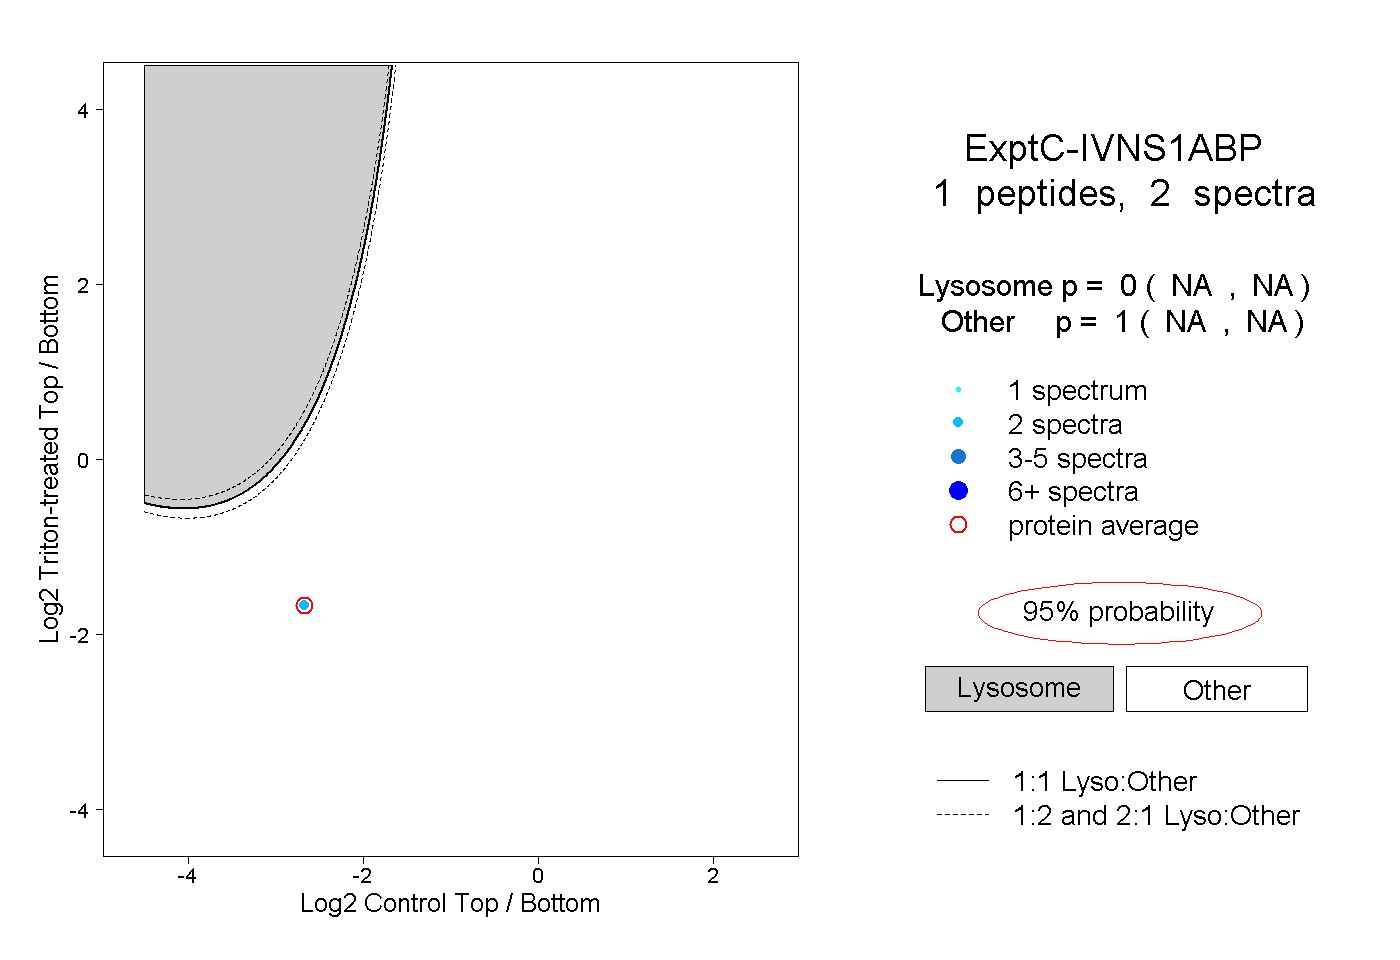 |
0.000 NA | NA |
1.000 NA | NA |