 12
12peptides
spectra
0.000 | 0.000
0.000 | 0.000
0.000 | 0.000
0.000 | 0.000
0.204 | 0.229
0.089 | 0.115
0.579 | 0.588
0.090 | 0.099
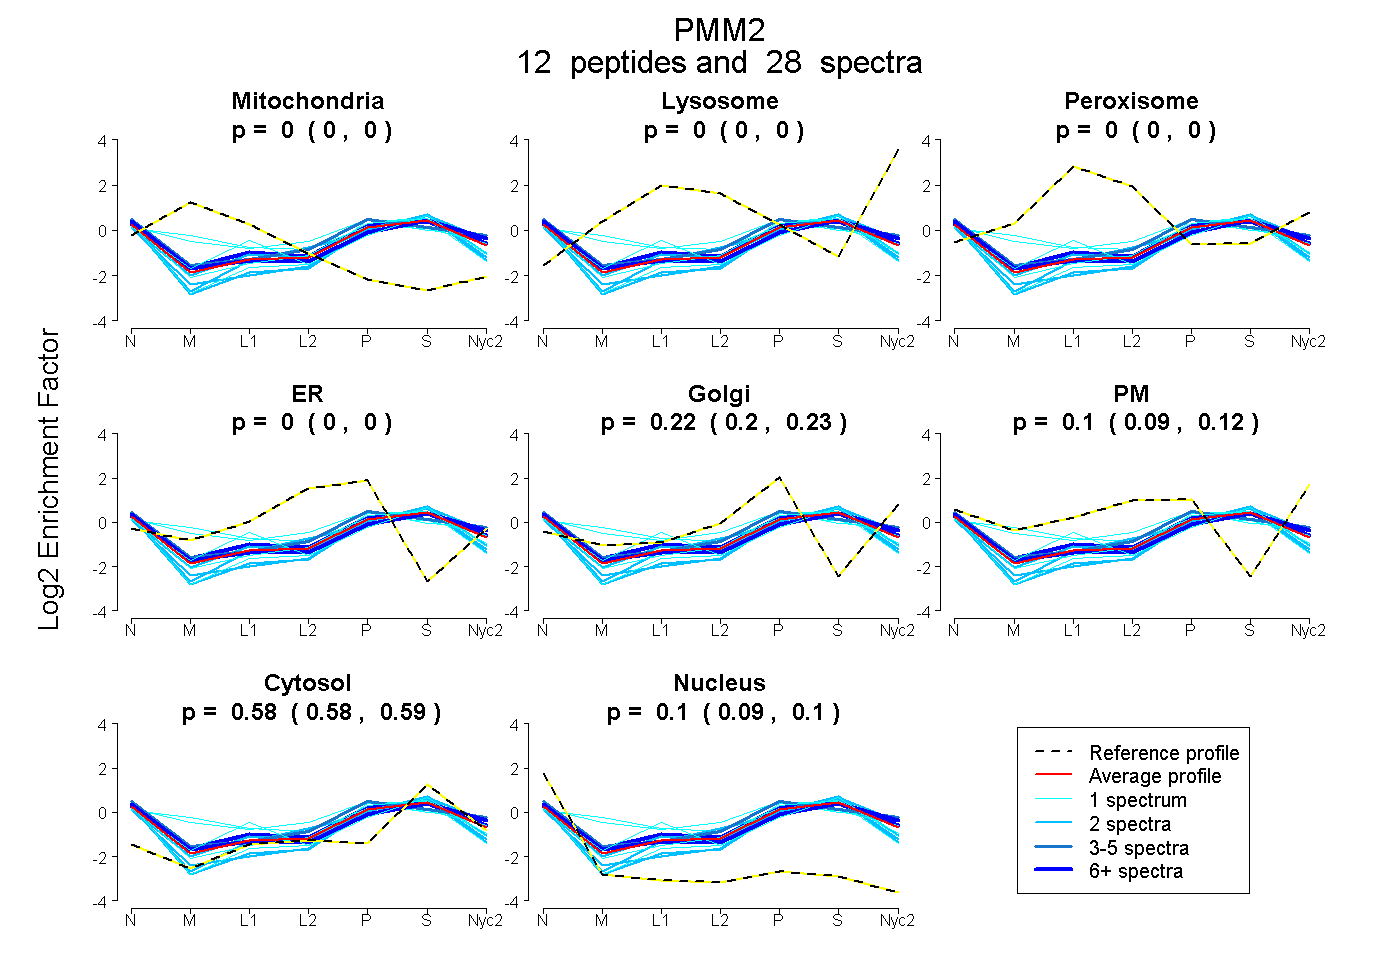
| Plot | Mito | Lyso | Perox | ER | Golgi | PM | Cytosol | Nucleus | |||||
| Expt A |
12 peptides |
28 spectra |
|
0.000 0.000 | 0.000 |
0.000 0.000 | 0.000 |
0.000 0.000 | 0.000 |
0.000 0.000 | 0.000 |
0.218 0.204 | 0.229 |
0.103 0.089 | 0.115 |
0.584 0.579 | 0.588 |
0.095 0.090 | 0.099 |
| 1 spectrum, LQEQLGNDVVEK | 0.091 | 0.000 | 0.021 | 0.000 | 0.188 | 0.282 | 0.417 | 0.000 | ||
| 1 spectrum, ICEELFP | 0.199 | 0.000 | 0.039 | 0.000 | 0.224 | 0.116 | 0.422 | 0.000 | ||
| 1 spectrum, TVGYTVTAPEDTR | 0.000 | 0.000 | 0.163 | 0.000 | 0.126 | 0.000 | 0.572 | 0.139 | ||
| 1 spectrum, IGVVGGSDFEK | 0.000 | 0.000 | 0.000 | 0.000 | 0.246 | 0.000 | 0.580 | 0.174 | ||
| 2 spectra, FVADLR | 0.000 | 0.000 | 0.000 | 0.000 | 0.204 | 0.000 | 0.653 | 0.143 | ||
| 1 spectrum, TMPGGNDHEIFTDPR | 0.000 | 0.000 | 0.000 | 0.031 | 0.276 | 0.000 | 0.589 | 0.104 | ||
| 3 spectra, NGMLNVSPIGR | 0.000 | 0.000 | 0.000 | 0.000 | 0.251 | 0.192 | 0.483 | 0.074 | ||
| 2 spectra, HLEQAGYK | 0.000 | 0.000 | 0.000 | 0.152 | 0.104 | 0.000 | 0.644 | 0.100 | ||
| 2 spectra, GTFIEFR | 0.000 | 0.000 | 0.000 | 0.000 | 0.176 | 0.000 | 0.636 | 0.188 | ||
| 2 spectra, IEFYELDK | 0.000 | 0.000 | 0.000 | 0.000 | 0.100 | 0.165 | 0.679 | 0.056 | ||
| 6 spectra, TIYFFGDK | 0.000 | 0.000 | 0.000 | 0.000 | 0.114 | 0.198 | 0.583 | 0.106 | ||
| 6 spectra, EMDGFLQK | 0.000 | 0.000 | 0.000 | 0.000 | 0.183 | 0.173 | 0.569 | 0.076 |
| Plot | Mito | Lyso or Perox | ER | Golgi | PM | Cytosol | Nucleus | ||||||
| Expt B |
3 peptides |
4 spectra |
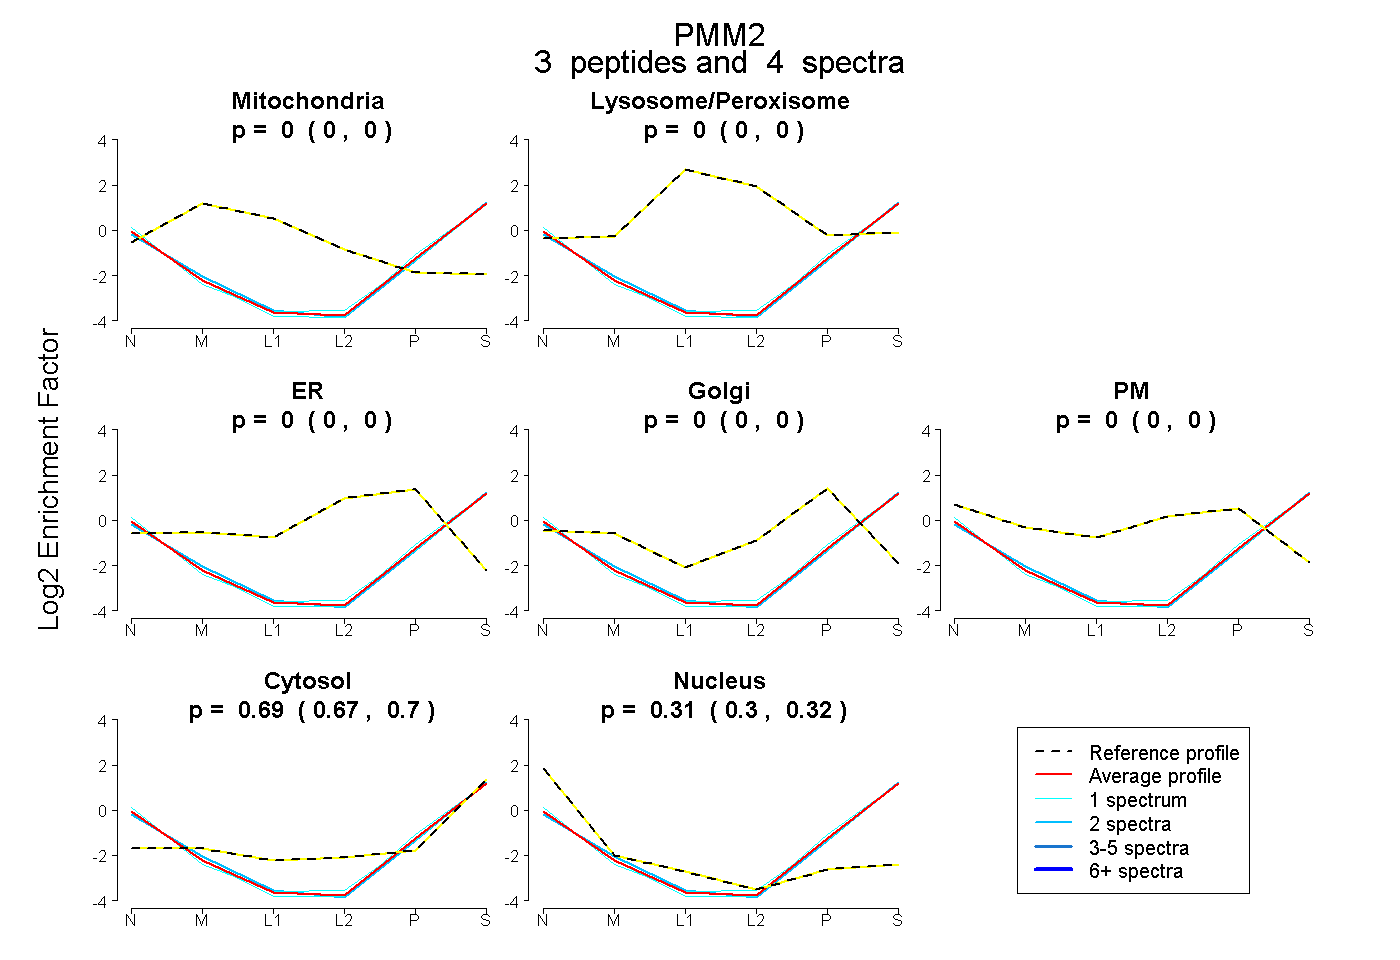 |
0.000 0.000 | 0.000 |
0.000 0.000 | 0.000 |
0.000 0.000 | 0.000 |
0.000 0.000 | 0.000 |
0.000 0.000 | 0.000 |
0.688 0.674 | 0.698 |
0.312 0.300 | 0.322 |
|||
| Plot | Lyso | Other | |||||||||||
| Expt C |
8 peptides |
24 spectra |
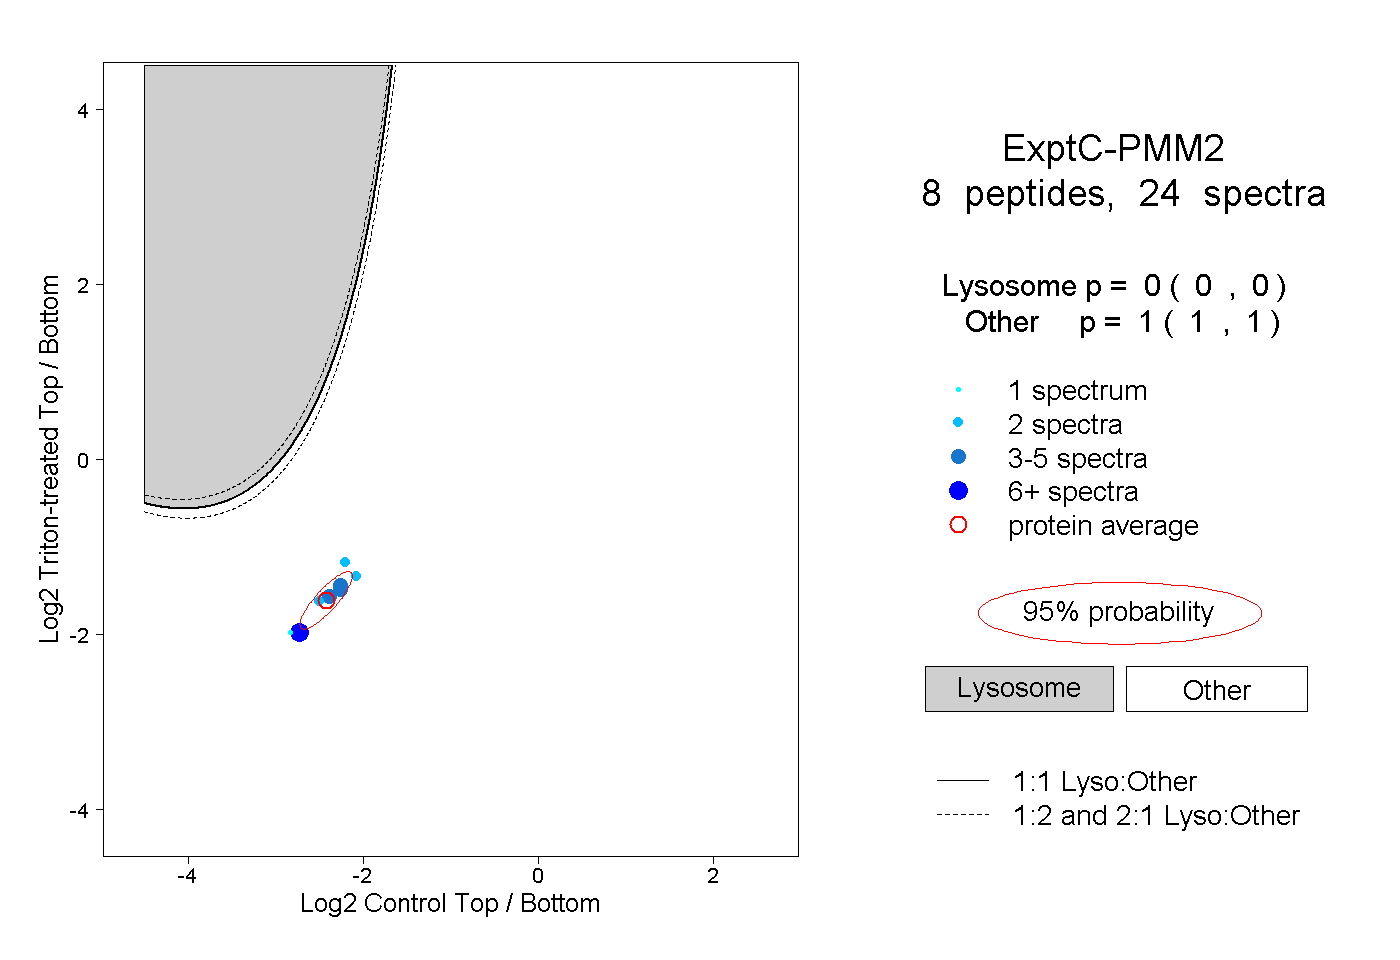 |
0.000 0.000 | 0.000 |
1.000 1.000 | 1.000 |
||||||||
| Plot | Lyso | Other | |||||||||||
| Expt D |
2 peptides |
3 spectra |
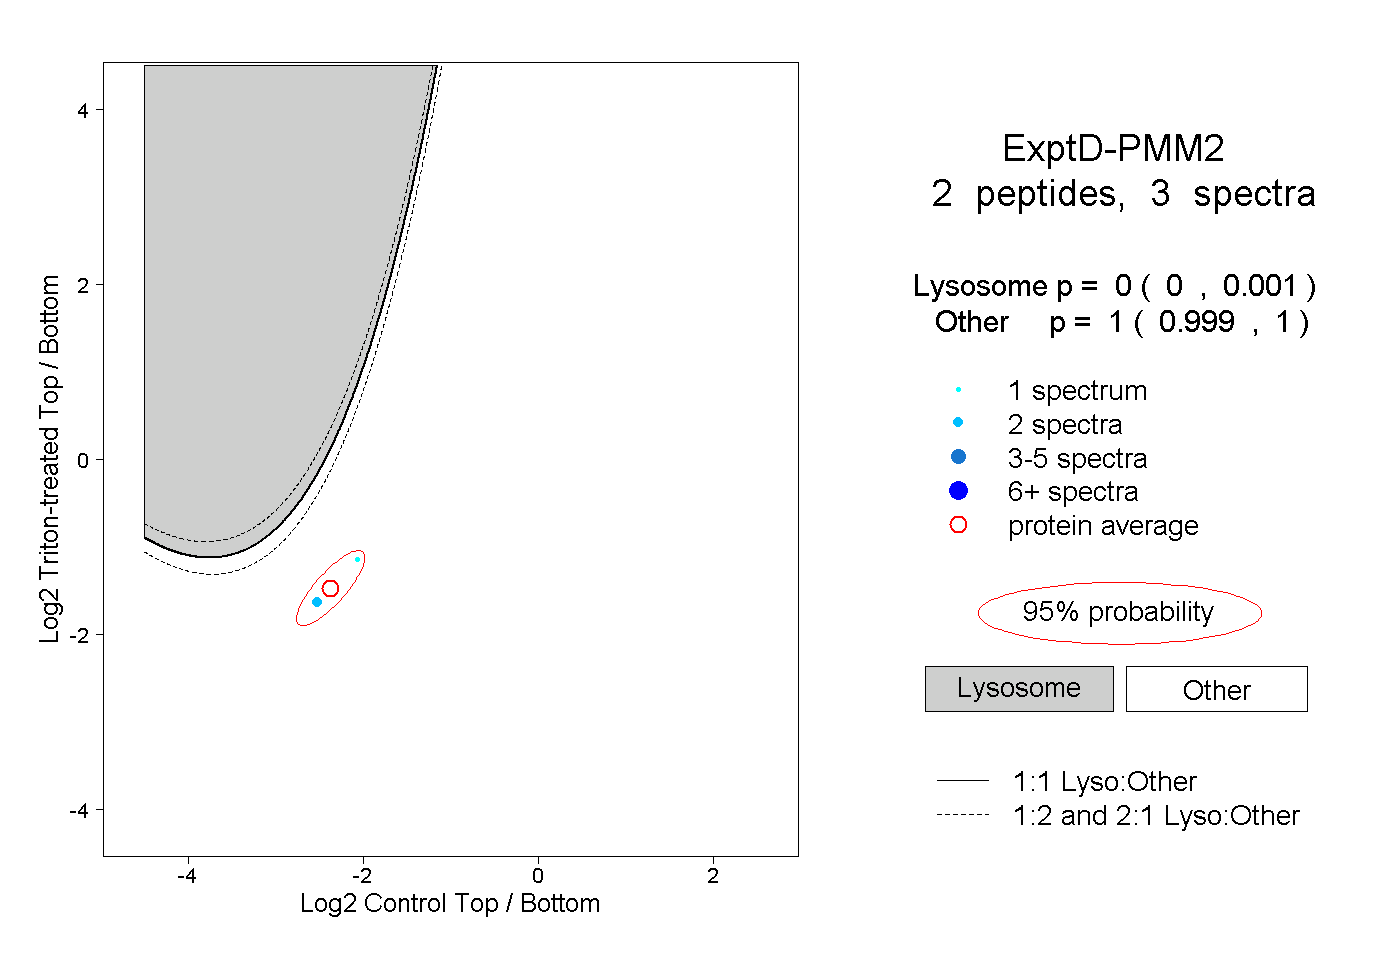 |
0.000 0.000 | 0.001 |
1.000 0.999 | 1.000 |