 3
3peptides
spectra
0.000 | 0.000
0.000 | 0.073
0.000 | 0.177
0.000 | 0.317
0.119 | 0.514
0.000 | 0.198
0.264 | 0.430
0.000 | 0.000
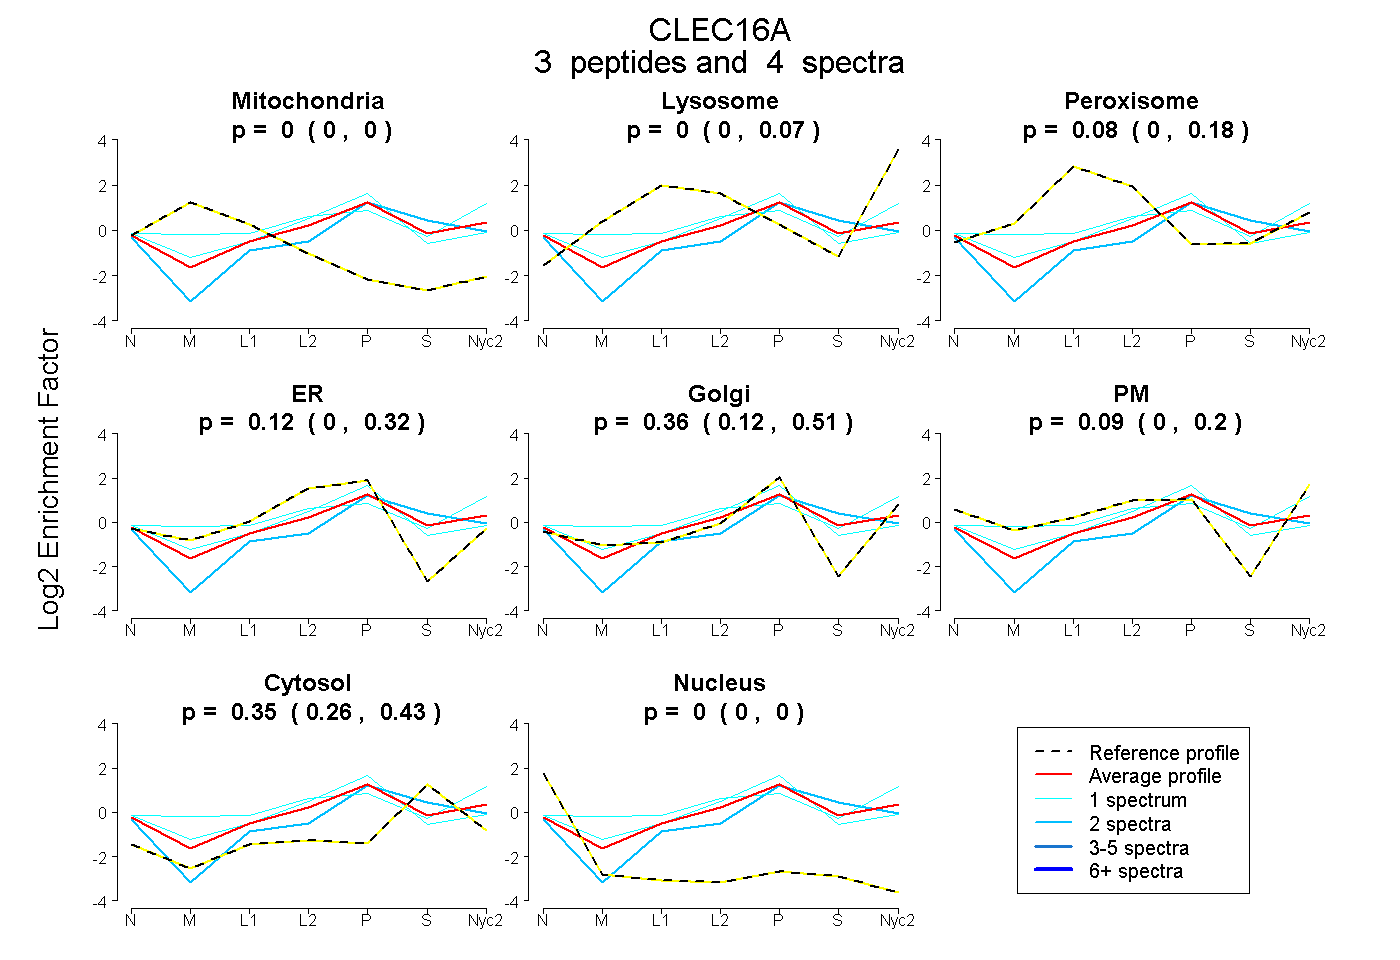
| Plot | Mito | Lyso | Perox | ER | Golgi | PM | Cytosol | Nucleus | |||||
| Expt A |
3 peptides |
4 spectra |
|
0.000 0.000 | 0.000 |
0.000 0.000 | 0.073 |
0.082 0.000 | 0.177 |
0.122 0.000 | 0.317 |
0.355 0.119 | 0.514 |
0.087 0.000 | 0.198 |
0.353 0.264 | 0.430 |
0.000 0.000 | 0.000 |
| 1 spectrum, SLSLQLR | 0.000 | 0.000 | 0.041 | 0.428 | 0.257 | 0.000 | 0.274 | 0.000 | ||
| 2 spectra, GSSDPTVQR | 0.000 | 0.000 | 0.000 | 0.020 | 0.428 | 0.000 | 0.553 | 0.000 | ||
| 1 spectrum, VFFMLR | 0.000 | 0.158 | 0.098 | 0.000 | 0.145 | 0.352 | 0.246 | 0.000 |