 4
4peptides
spectra
0.000 | 0.000
0.059 | 0.111
0.000 | 0.000
0.000 | 0.000
0.100 | 0.221
0.390 | 0.508
0.262 | 0.326
0.000 | 0.000
5peptides
spectra
0.000 | 0.000
1.000 | 1.000
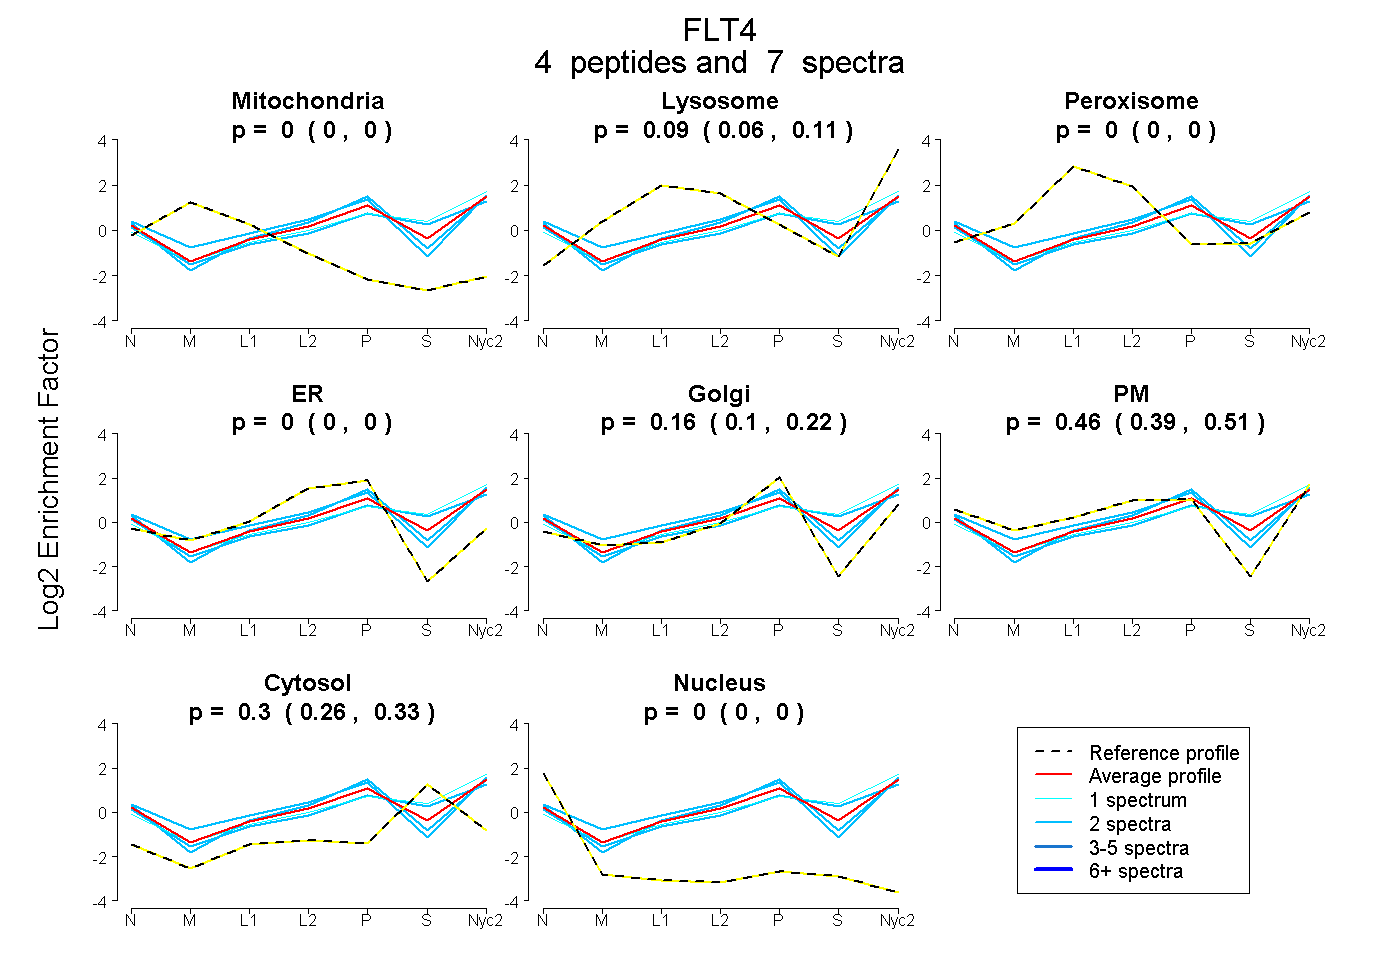
| Plot | Mito | Lyso | Perox | ER | Golgi | PM | Cytosol | Nucleus | |||||
| Expt A |
4 peptides |
7 spectra |
|
0.000 0.000 | 0.000 |
0.086 0.059 | 0.111 |
0.000 0.000 | 0.000 |
0.000 0.000 | 0.000 |
0.163 0.100 | 0.221 |
0.455 0.390 | 0.508 |
0.296 0.262 | 0.326 |
0.000 0.000 | 0.000 |
||
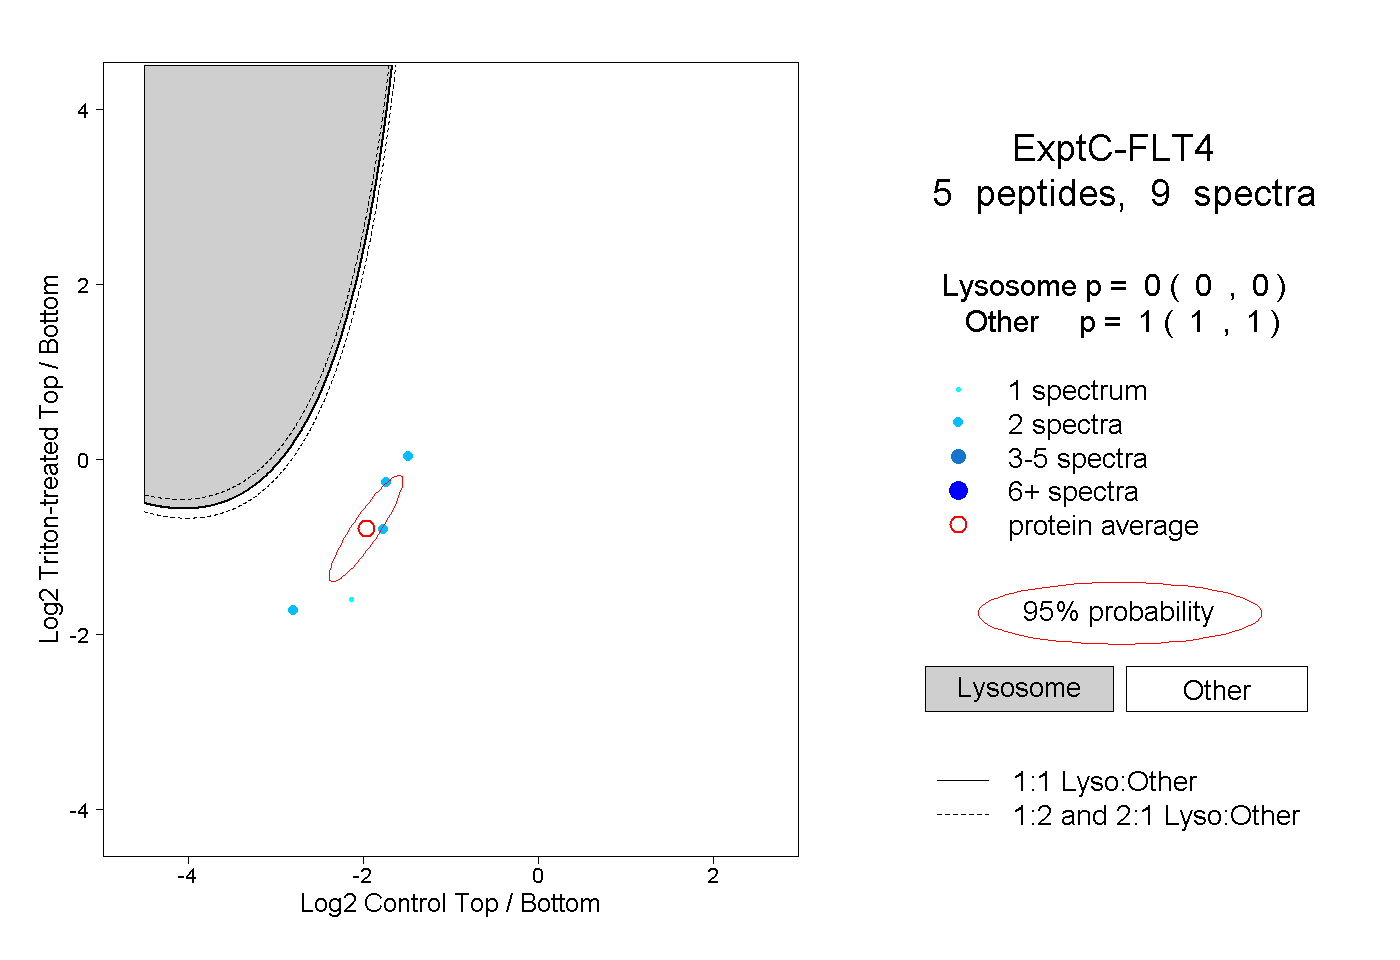
| Plot | Lyso | Other | |||||||||||
| Expt C |
5 peptides |
9 spectra |
|
0.000 0.000 | 0.000 |
1.000 1.000 | 1.000 |