 3
3peptides
spectra
0.000 | 0.000
0.000 | 0.000
0.000 | 0.011
0.000 | 0.000
0.000 | 0.000
0.139 | 0.176
0.816 | 0.857
0.000 | 0.000
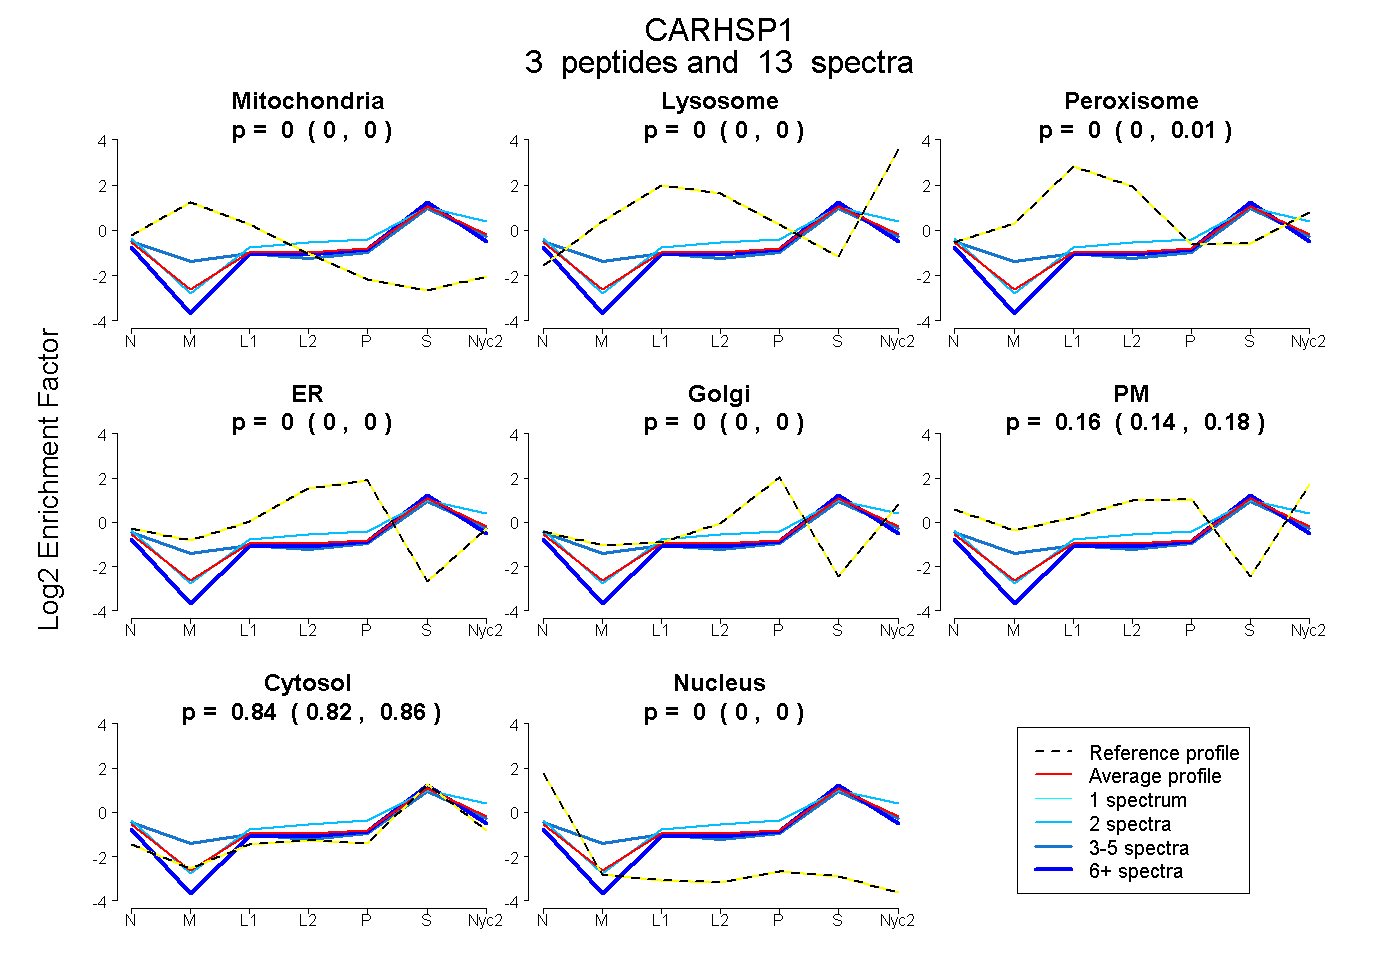
| Plot | Mito | Lyso | Perox | ER | Golgi | PM | Cytosol | Nucleus | |||||
| Expt A |
3 peptides |
13 spectra |
|
0.000 0.000 | 0.000 |
0.000 0.000 | 0.000 |
0.000 0.000 | 0.011 |
0.000 0.000 | 0.000 |
0.000 0.000 | 0.000 |
0.161 0.139 | 0.176 |
0.839 0.816 | 0.857 |
0.000 0.000 | 0.000 |
| 2 spectra, TFSATVR | 0.000 | 0.032 | 0.000 | 0.000 | 0.000 | 0.223 | 0.745 | 0.000 | ||
| 7 spectra, GNVVPSPLPTR | 0.000 | 0.000 | 0.000 | 0.000 | 0.026 | 0.031 | 0.943 | 0.000 | ||
| 4 spectra, ASQGPVYK | 0.064 | 0.000 | 0.023 | 0.000 | 0.000 | 0.150 | 0.763 | 0.000 |
| Plot | Mito | Lyso or Perox | ER | Golgi | PM | Cytosol | Nucleus | ||||||
| Expt B |
2 peptides |
3 spectra |
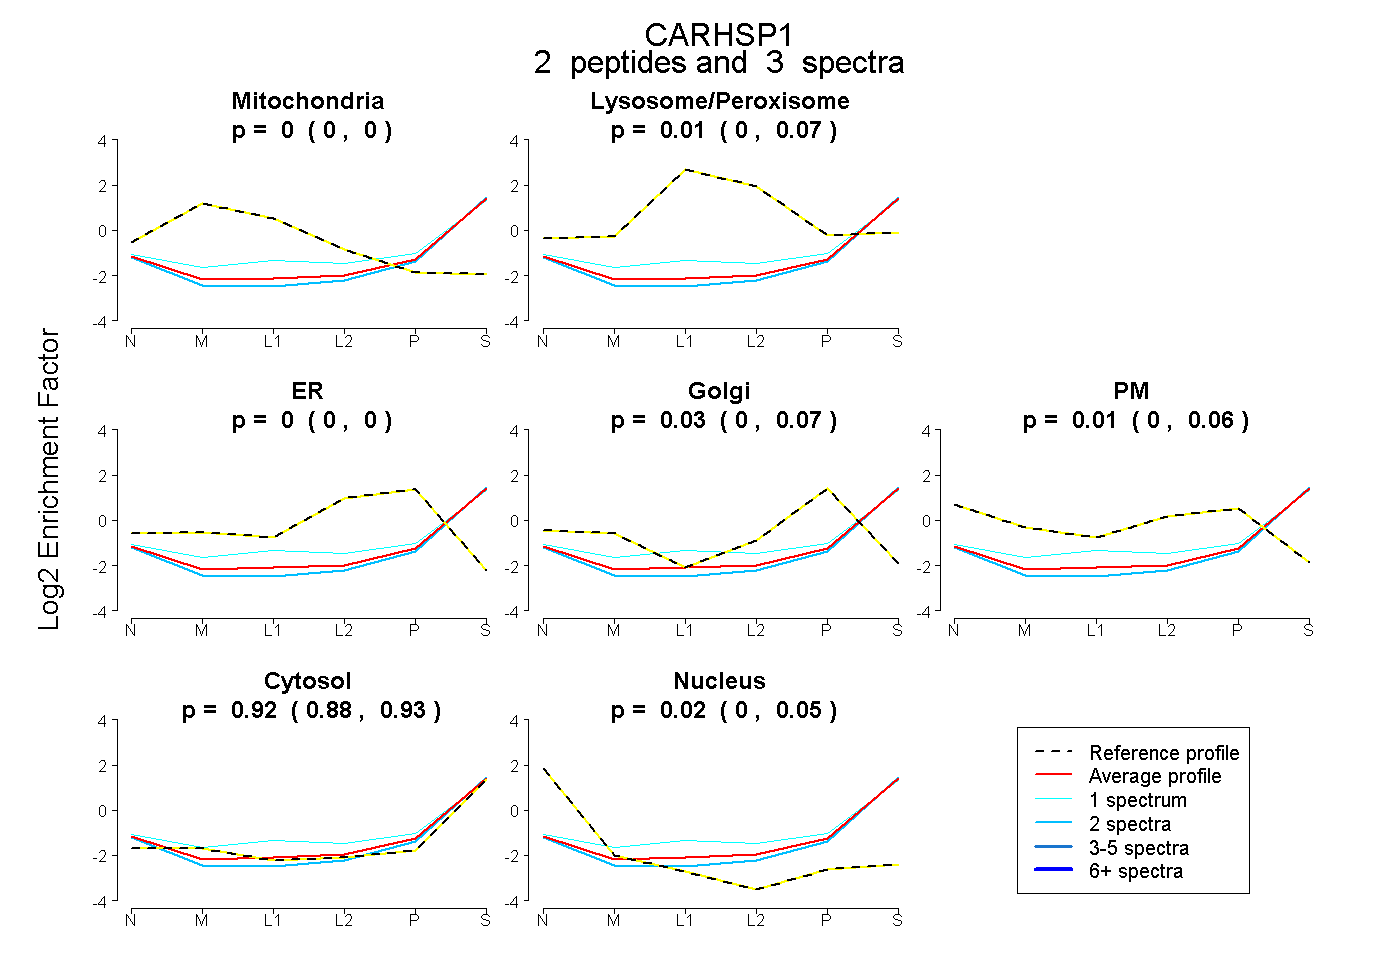 |
0.000 0.000 | 0.000 |
0.014 0.000 | 0.071 |
0.000 0.000 | 0.003 |
0.034 0.000 | 0.068 |
0.015 0.000 | 0.064 |
0.916 0.878 | 0.932 |
0.021 0.000 | 0.049 |
|||
| Plot | Lyso | Other | |||||||||||
| Expt C |
4 peptides |
29 spectra |
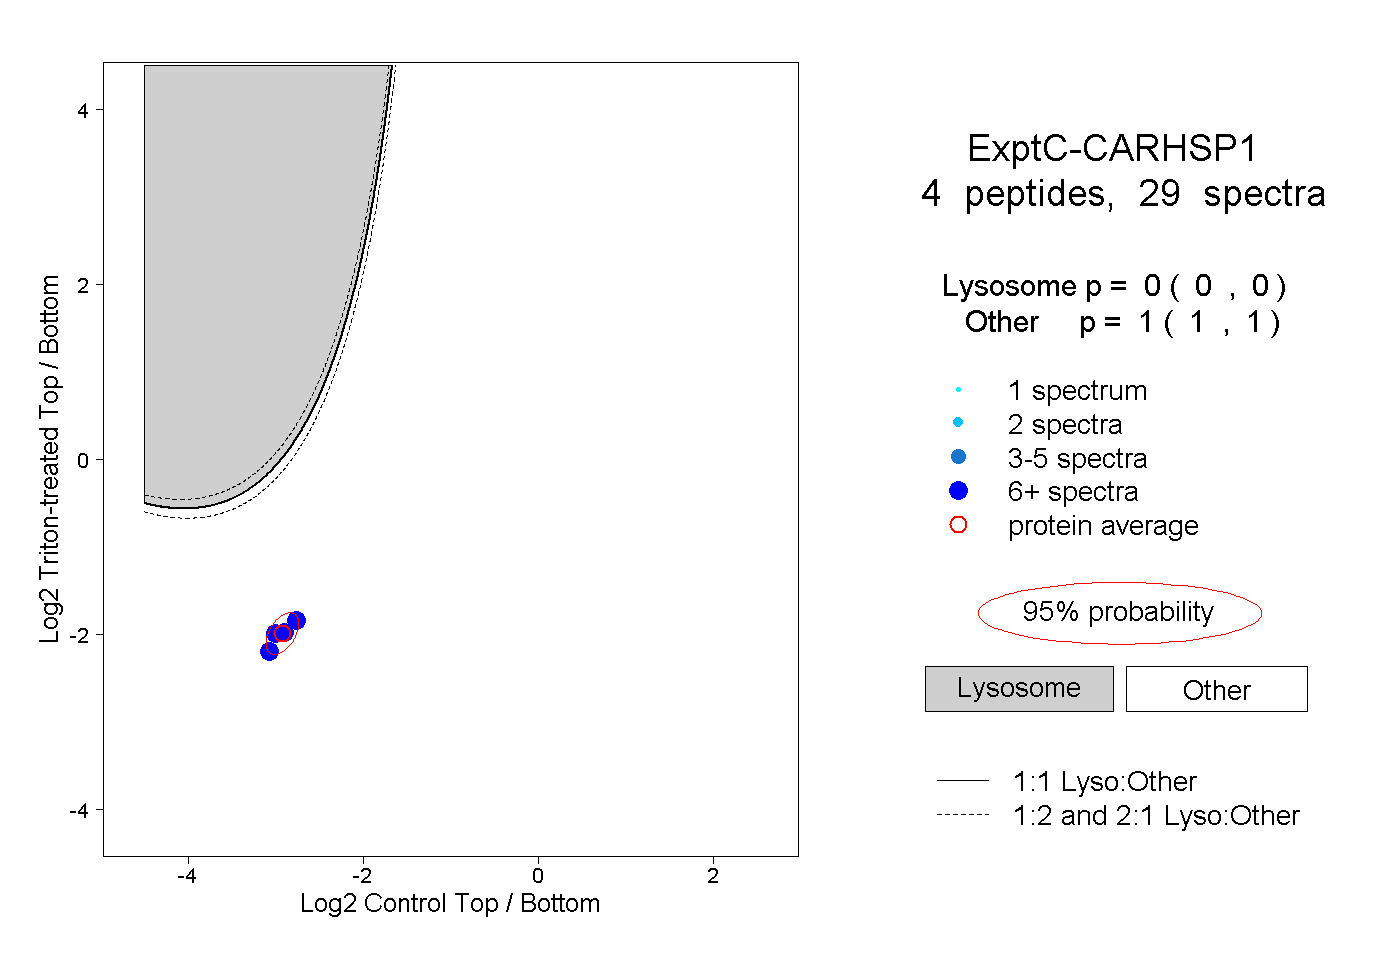 |
0.000 0.000 | 0.000 |
1.000 1.000 | 1.000 |
||||||||
| Plot | Lyso | Other | |||||||||||
| Expt D |
1 peptide |
3 spectra |
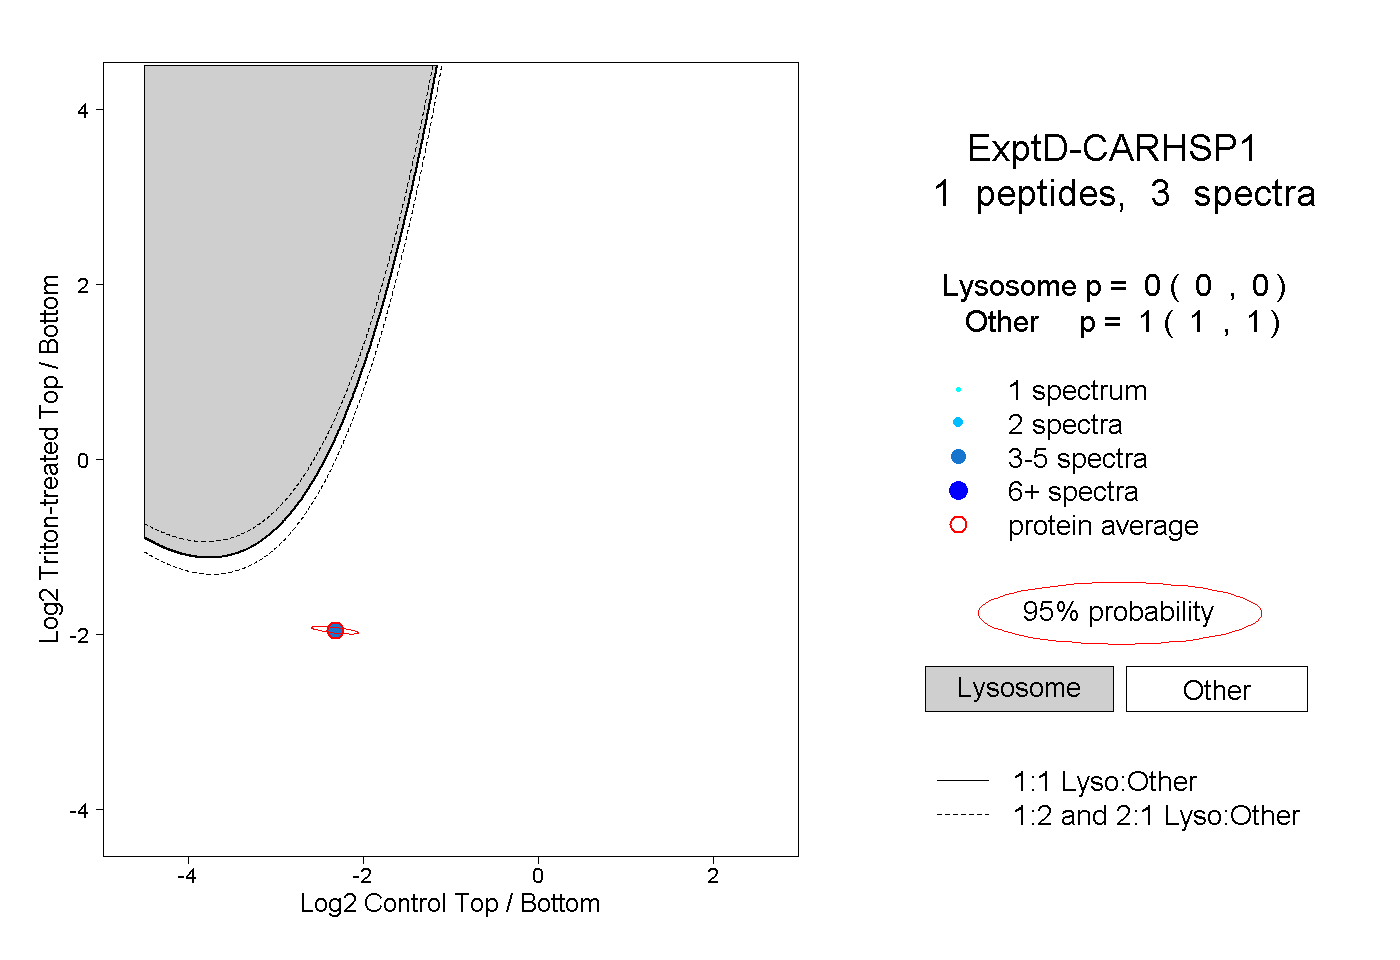 |
0.000 0.000 | 0.000 |
1.000 1.000 | 1.000 |