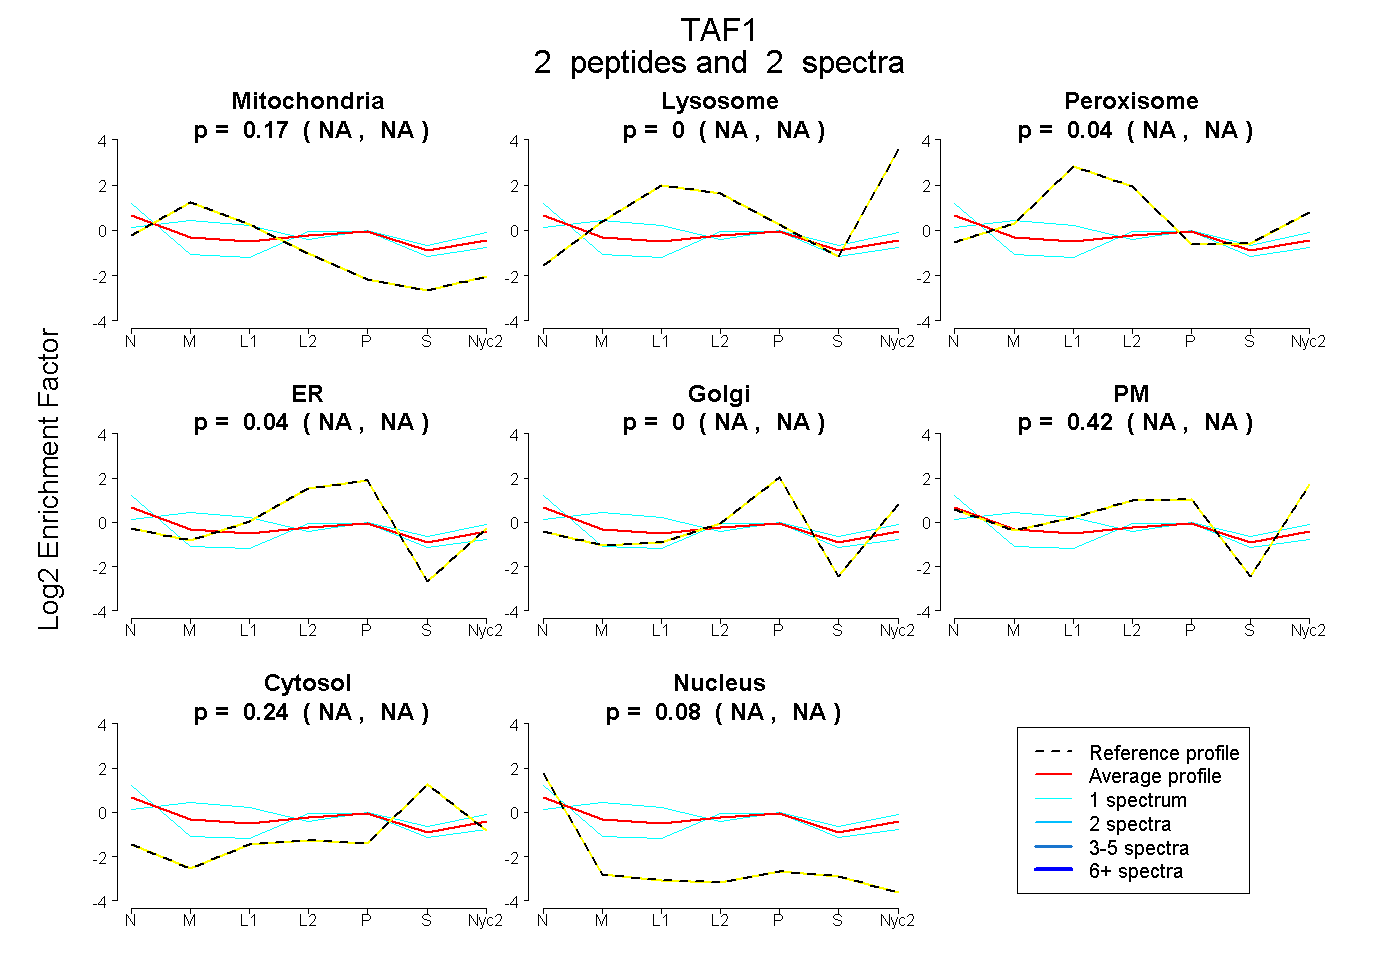
 2
2peptides
spectra
NA | NA
NA | NA
NA | NA
NA | NA
NA | NA
NA | NA
NA | NA
NA | NA
| Plot | Mito | Lyso | Perox | ER | Golgi | PM | Cytosol | Nucleus | |||||
| Expt A |
2 peptides |
2 spectra |
|
0.173 NA | NA |
0.000 NA | NA |
0.043 NA | NA |
0.038 NA | NA |
0.000 NA | NA |
0.418 NA | NA |
0.244 NA | NA |
0.084 NA | NA |
| 1 spectrum, EPQPVK | 0.272 | 0.000 | 0.195 | 0.000 | 0.131 | 0.203 | 0.199 | 0.000 | ||
| 1 spectrum, TMSTEQAR | 0.000 | 0.000 | 0.039 | 0.138 | 0.000 | 0.380 | 0.181 | 0.263 |
| Plot | Lyso | Other | |||||||||||
| Expt C |
1 peptide |
1 spectrum |
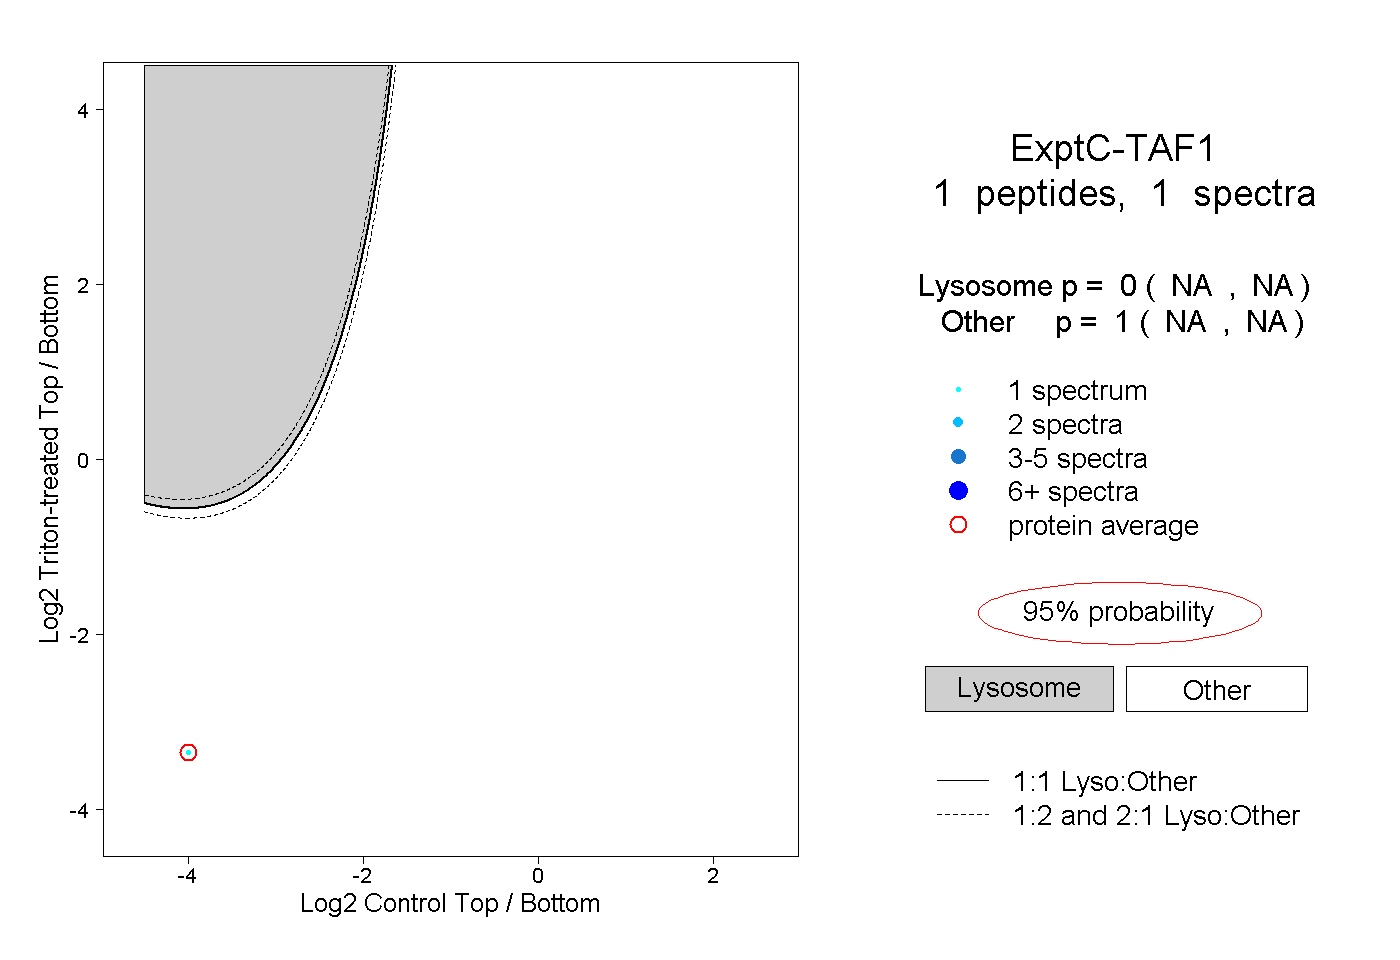 |
0.000 NA | NA |
1.000 NA | NA |