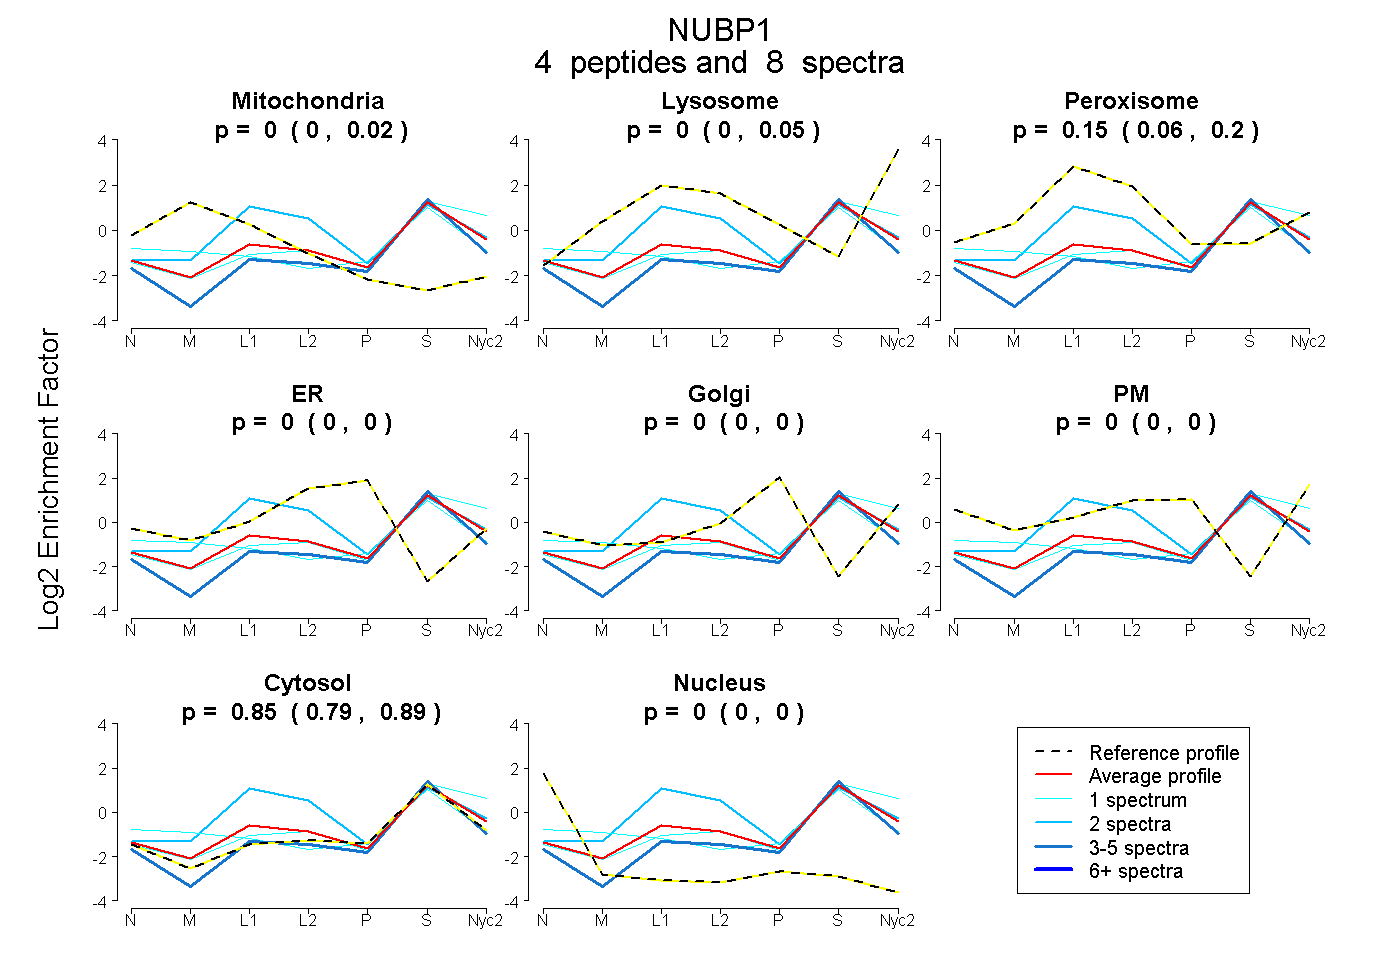
 4
4peptides
spectra
0.000 | 0.024
0.000 | 0.055
0.063 | 0.198
0.000 | 0.000
0.000 | 0.000
0.000 | 0.000
0.790 | 0.887
0.000 | 0.000
| Plot | Mito | Lyso | Perox | ER | Golgi | PM | Cytosol | Nucleus | |||||
| Expt A |
4 peptides |
8 spectra |
|
0.000 0.000 | 0.024 |
0.000 0.000 | 0.055 |
0.154 0.063 | 0.198 |
0.000 0.000 | 0.000 |
0.000 0.000 | 0.000 |
0.000 0.000 | 0.000 |
0.846 0.790 | 0.887 |
0.000 0.000 | 0.000 |
| 4 spectra, VPLDPHIGK | 0.000 | 0.000 | 0.000 | 0.000 | 0.000 | 0.000 | 1.000 | 0.000 | ||
| 1 spectrum, ILVLSGK | 0.000 | 0.169 | 0.000 | 0.000 | 0.000 | 0.000 | 0.831 | 0.000 | ||
| 1 spectrum, GASCQGCPNQK | 0.228 | 0.003 | 0.000 | 0.000 | 0.000 | 0.000 | 0.769 | 0.000 | ||
| 2 spectra, EFCNSR | 0.000 | 0.000 | 0.479 | 0.000 | 0.000 | 0.000 | 0.521 | 0.000 |
| Plot | Lyso | Other | |||||||||||
| Expt C |
6 peptides |
16 spectra |
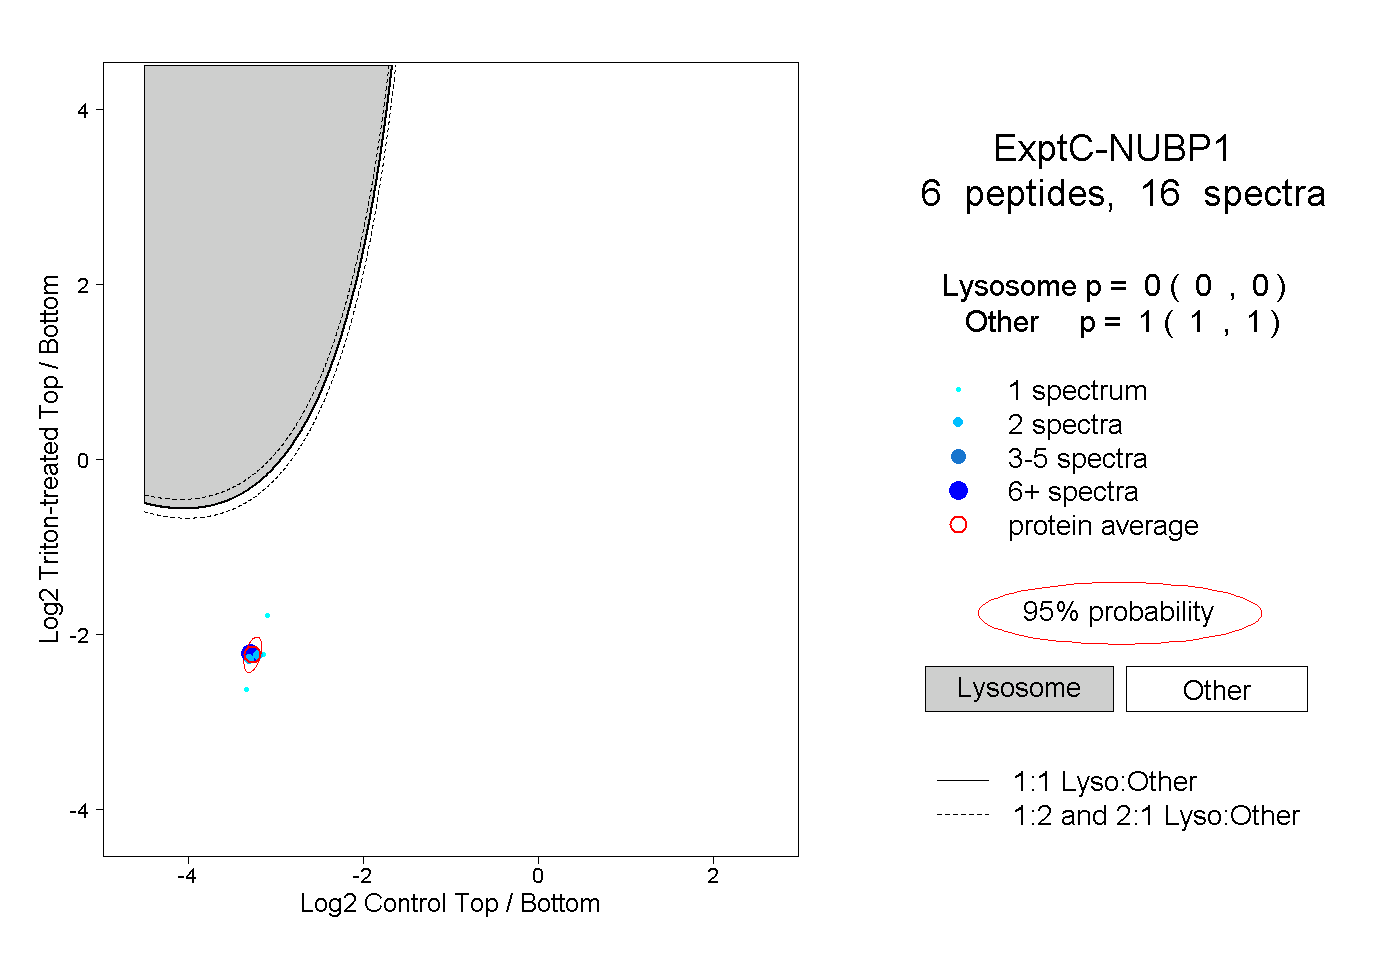 |
0.000 0.000 | 0.000 |
1.000 1.000 | 1.000 |
||||||||
| Plot | Lyso | Other | |||||||||||
| Expt D |
1 peptide |
1 spectrum |
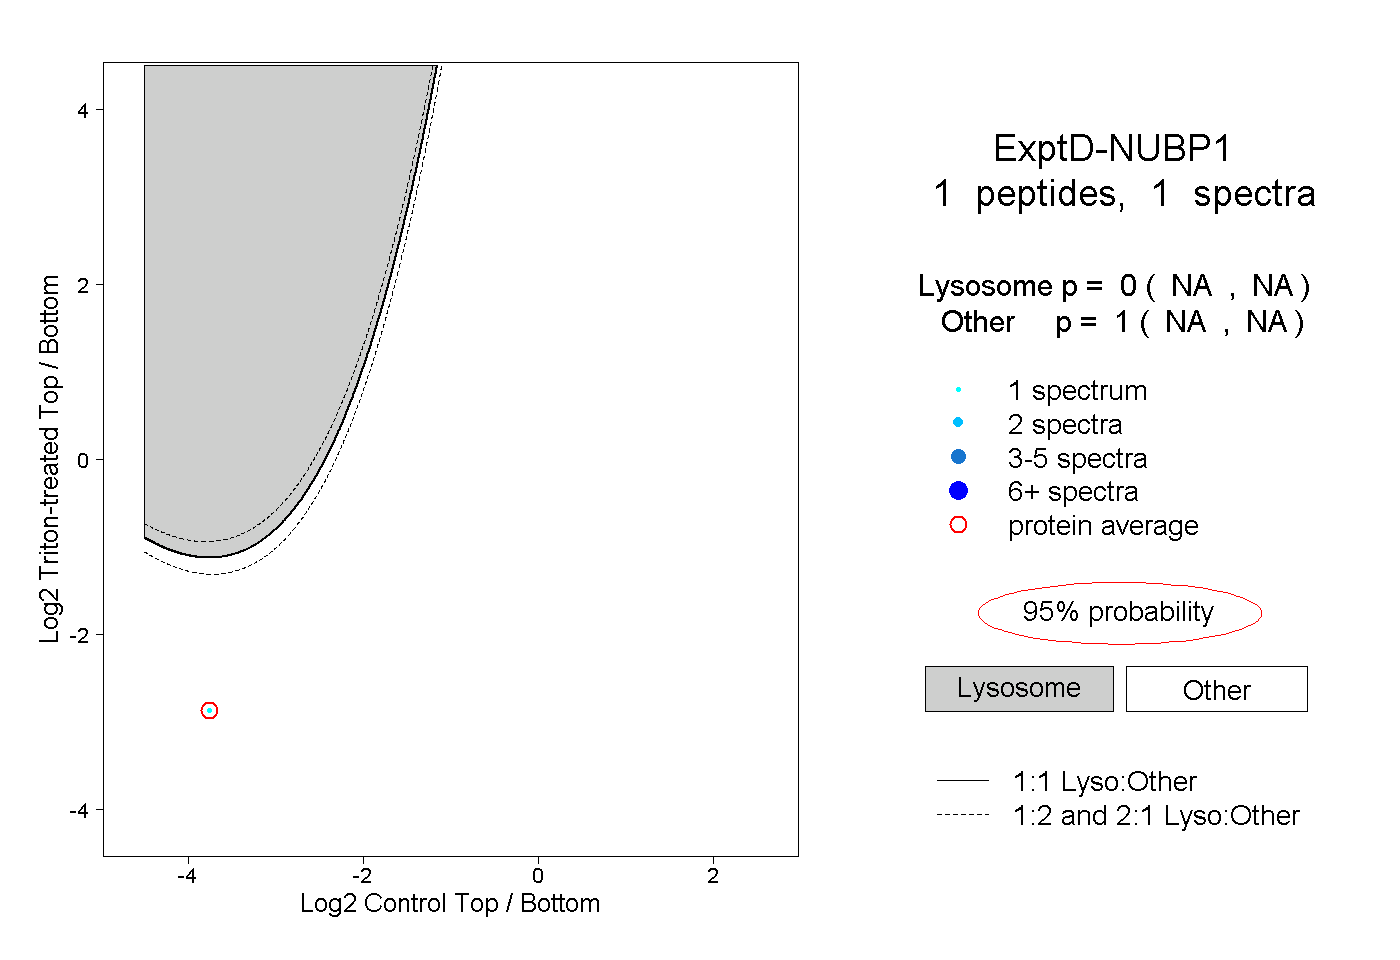 |
0.000 NA | NA |
1.000 NA | NA |