 3
3peptides
spectra
0.000 | 0.047
0.000 | 0.217
0.035 | 0.271
0.000 | 0.000
0.000 | 0.080
0.058 | 0.202
0.503 | 0.590
0.000 | 0.000
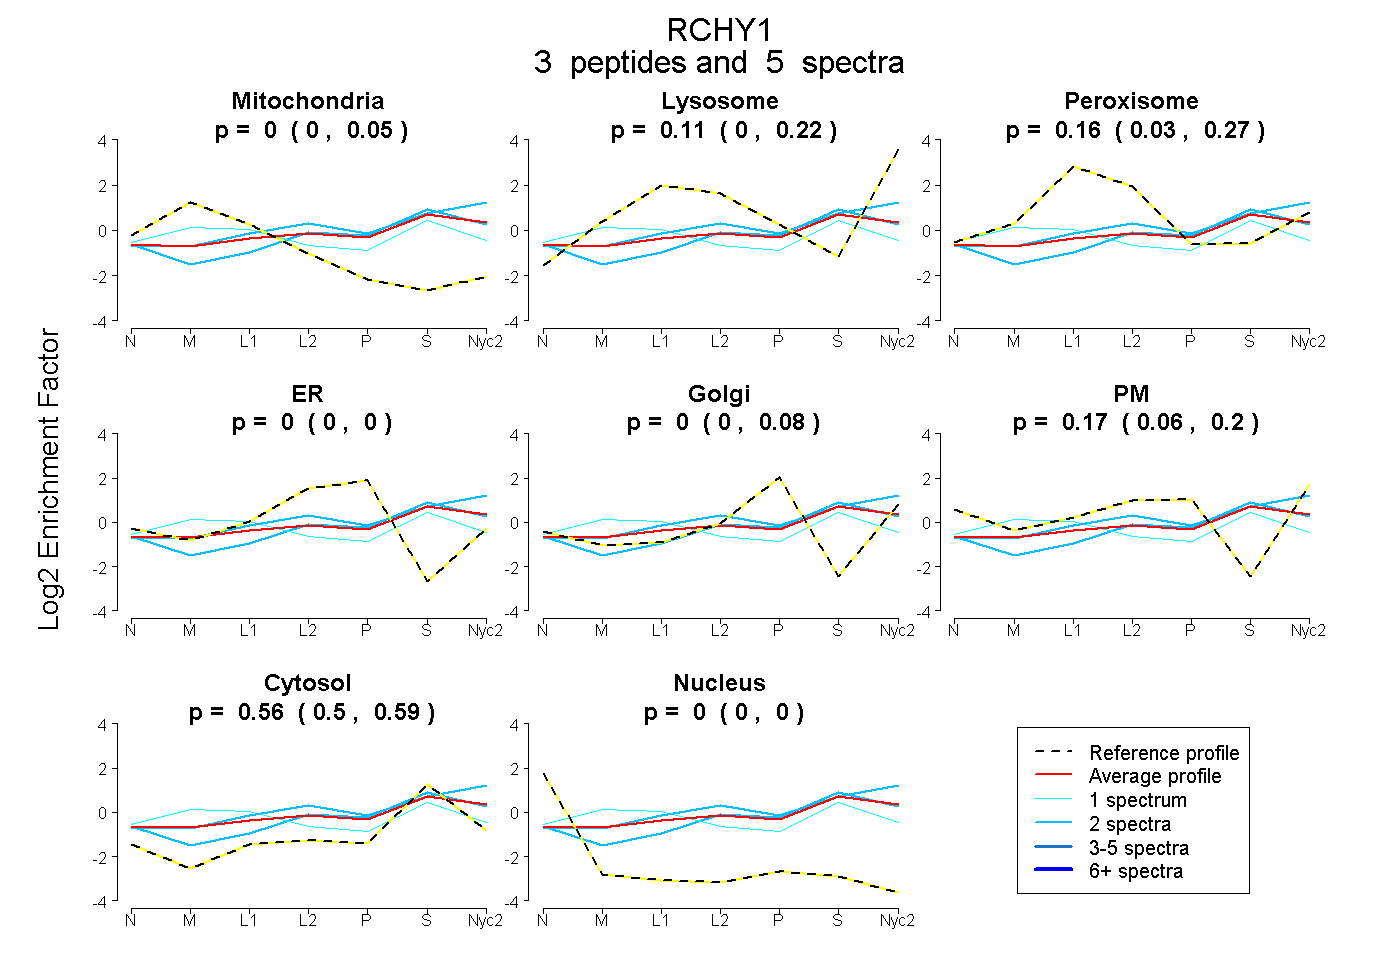
| Plot | Mito | Lyso | Perox | ER | Golgi | PM | Cytosol | Nucleus | |||||
| Expt A |
3 peptides |
5 spectra |
|
0.000 0.000 | 0.047 |
0.106 0.000 | 0.217 |
0.162 0.035 | 0.271 |
0.000 0.000 | 0.000 |
0.000 0.000 | 0.080 |
0.173 0.058 | 0.202 |
0.559 0.503 | 0.590 |
0.000 0.000 | 0.000 |
| 2 spectra, VVAHVLPCGHLLHR | 0.000 | 0.347 | 0.041 | 0.000 | 0.000 | 0.121 | 0.491 | 0.000 | ||
| 1 spectrum, TCYEEMLK | 0.257 | 0.065 | 0.228 | 0.000 | 0.000 | 0.000 | 0.450 | 0.000 | ||
| 2 spectra, GCEHYDR | 0.000 | 0.091 | 0.016 | 0.000 | 0.000 | 0.227 | 0.666 | 0.000 |