 3
3peptides
spectra
0.000 | 0.290
0.000 | 0.020
0.000 | 0.042
0.000 | 0.200
0.000 | 0.103
0.000 | 0.000
0.582 | 0.780
0.000 | 0.100
1peptide
spectrum
NA | NA
NA | NA
NA | NA
NA | NA
NA | NA
NA | NA
NA | NA
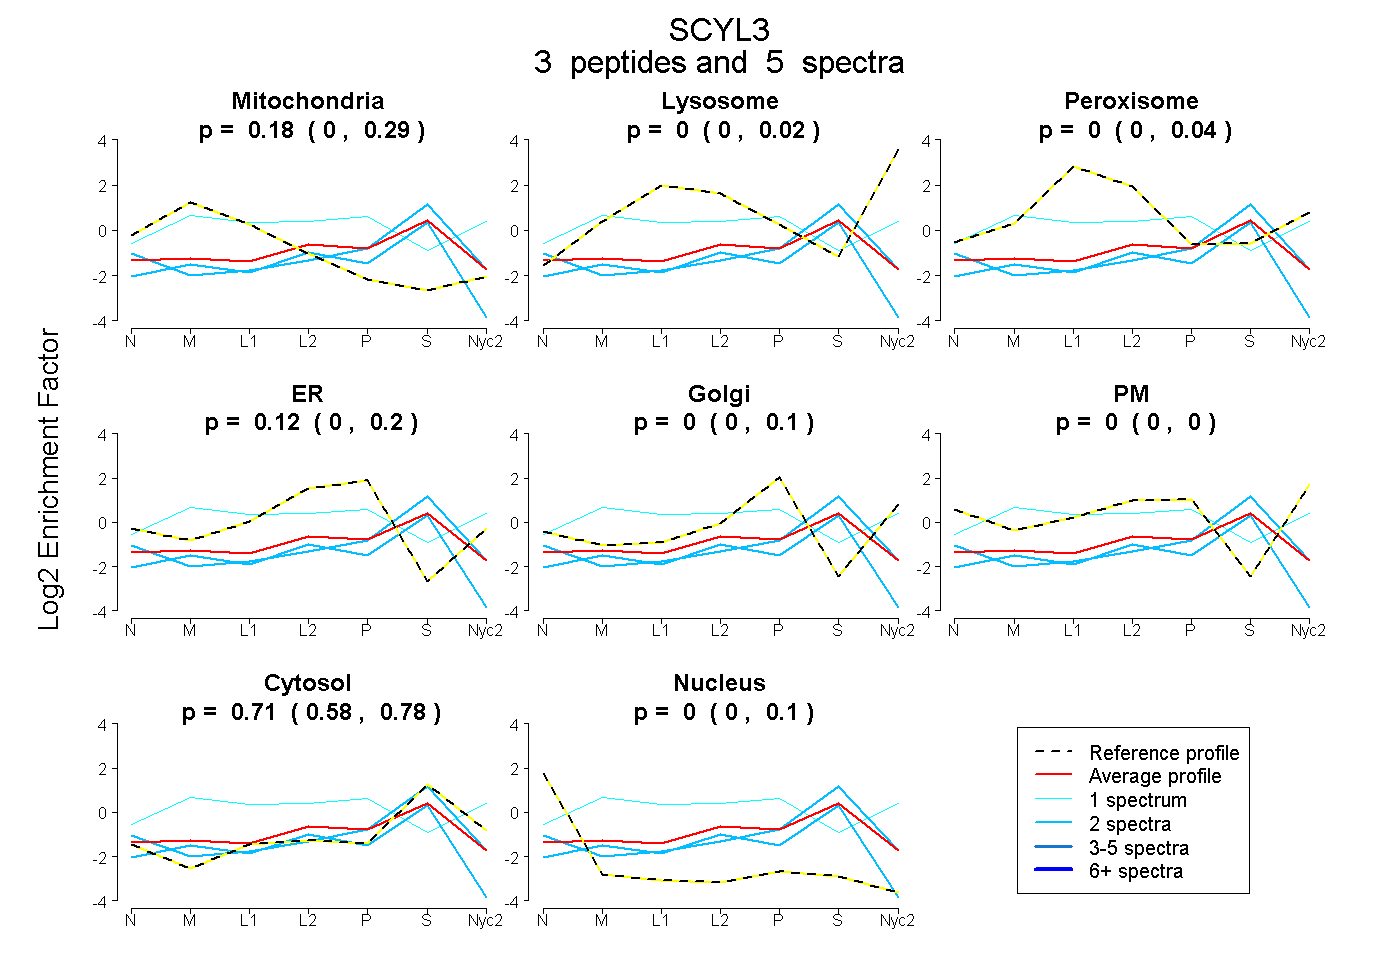
| Plot | Mito | Lyso | Perox | ER | Golgi | PM | Cytosol | Nucleus | |||||
| Expt A |
3 peptides |
5 spectra |
|
0.175 0.000 | 0.290 |
0.000 0.000 | 0.020 |
0.000 0.000 | 0.042 |
0.119 0.000 | 0.200 |
0.000 0.000 | 0.103 |
0.000 0.000 | 0.000 |
0.706 0.582 | 0.780 |
0.000 0.000 | 0.100 |
||
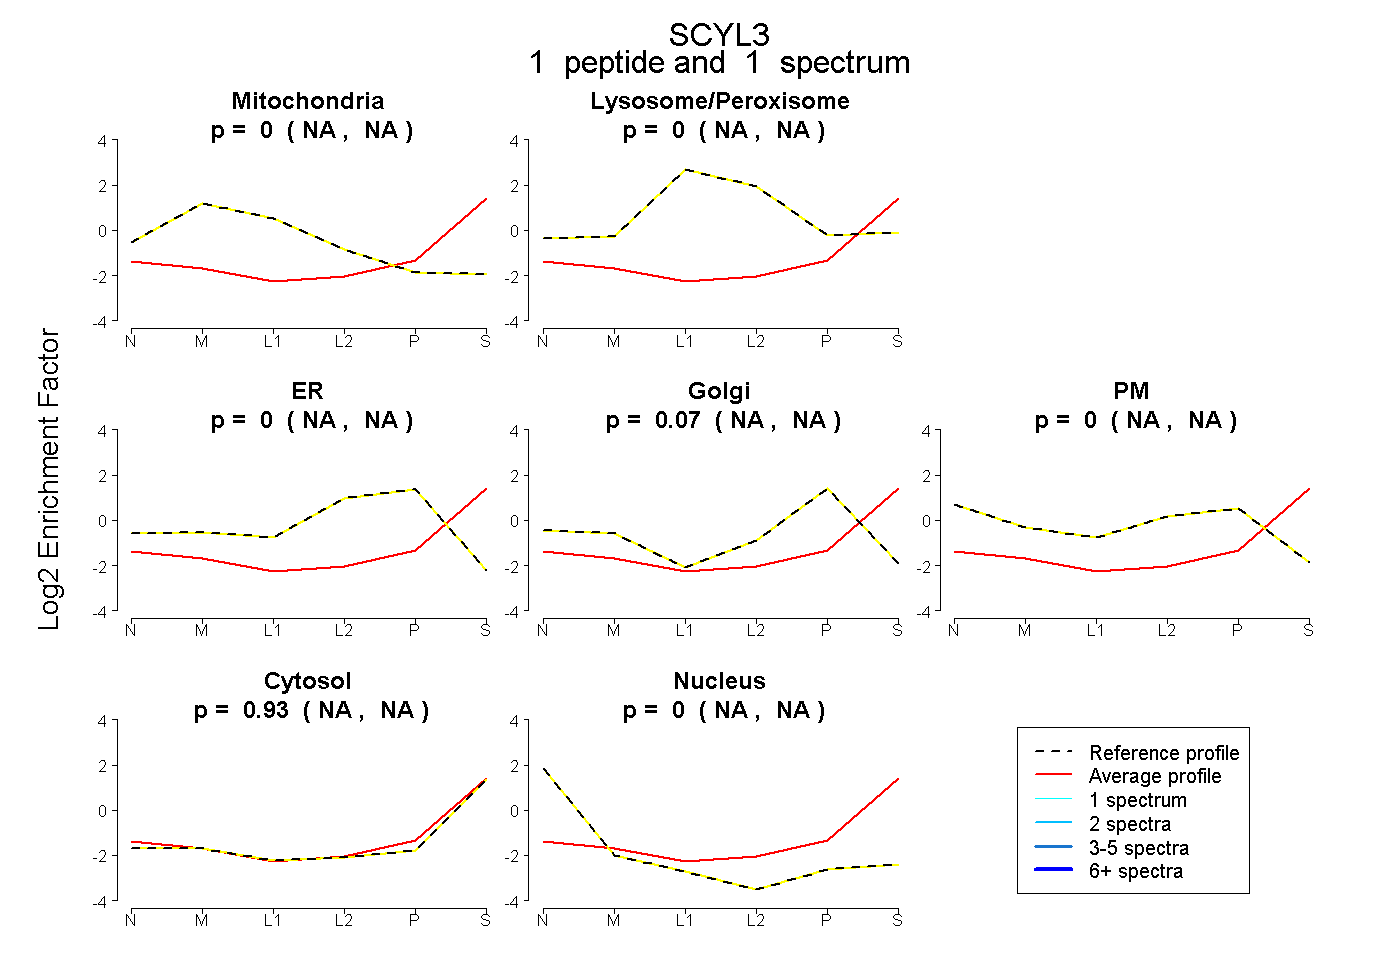
| Plot | Mito | Lyso or Perox | ER | Golgi | PM | Cytosol | Nucleus | ||||||
| Expt B |
1 peptide |
1 spectrum |
|
0.000 NA | NA |
0.000 NA | NA |
0.000 NA | NA |
0.070 NA | NA |
0.000 NA | NA |
0.930 NA | NA |
0.000 NA | NA |