 4
4peptides
spectra
0.484 | 0.585
0.000 | 0.090
0.060 | 0.207
0.000 | 0.000
0.000 | 0.000
0.182 | 0.305
0.000 | 0.068
0.000 | 0.022
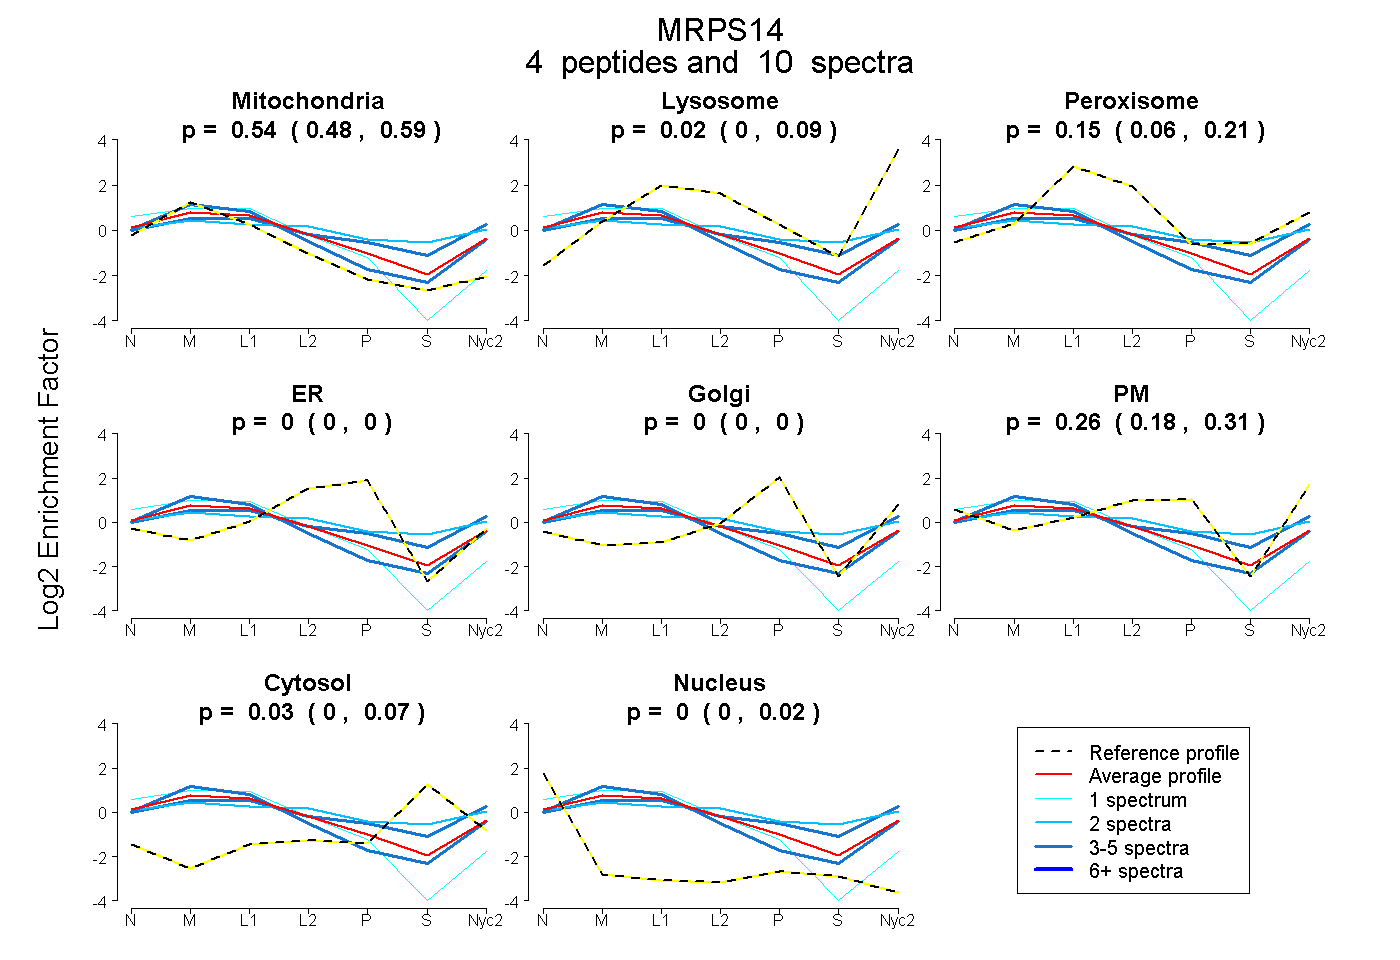
| Plot | Mito | Lyso | Perox | ER | Golgi | PM | Cytosol | Nucleus | |||||
| Expt A |
4 peptides |
10 spectra |
|
0.543 0.484 | 0.585 |
0.024 0.000 | 0.090 |
0.150 0.060 | 0.207 |
0.000 0.000 | 0.000 |
0.000 0.000 | 0.000 |
0.257 0.182 | 0.305 |
0.026 0.000 | 0.068 |
0.000 0.000 | 0.022 |
| 3 spectra, DLQEMAGDEIAALPR | 0.345 | 0.124 | 0.126 | 0.000 | 0.000 | 0.260 | 0.146 | 0.000 | ||
| 1 spectrum, CVMTSRPR | 0.771 | 0.000 | 0.000 | 0.189 | 0.000 | 0.040 | 0.000 | 0.000 | ||
| 4 spectra, MAYEYADER | 0.727 | 0.191 | 0.024 | 0.000 | 0.000 | 0.058 | 0.000 | 0.000 | ||
| 2 spectra, HLADHGLLSGVQR | 0.233 | 0.000 | 0.264 | 0.000 | 0.000 | 0.282 | 0.221 | 0.000 |
| Plot | Lyso | Other | |||||||||||
| Expt C |
2 peptides |
4 spectra |
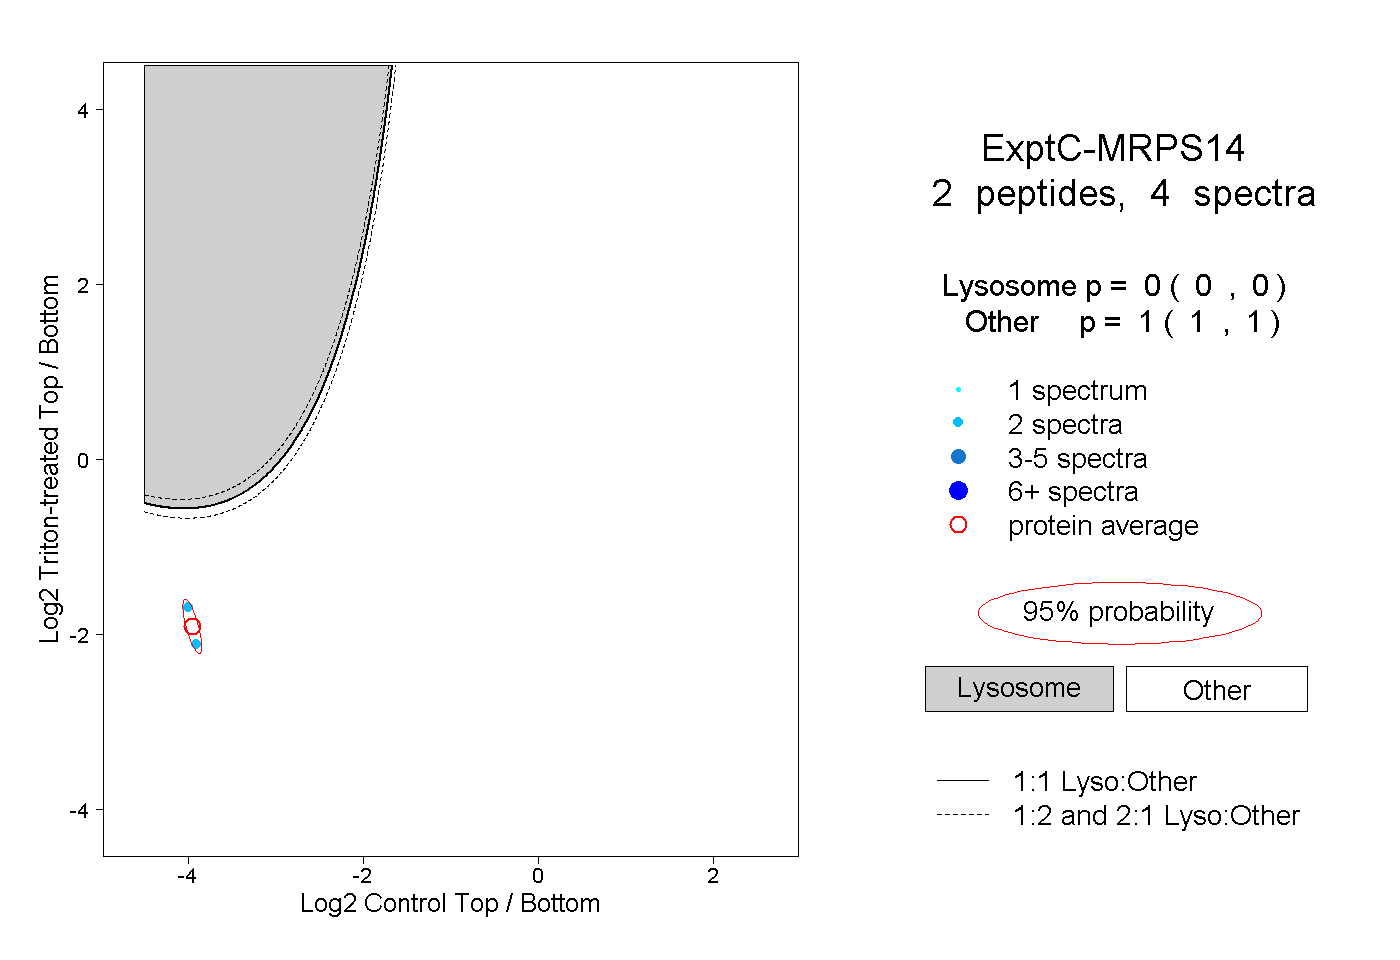 |
0.000 0.000 | 0.000 |
1.000 1.000 | 1.000 |