 2
2peptides
spectra
0.000 | 0.000
0.068 | 0.099
0.075 | 0.126
0.000 | 0.000
0.341 | 0.415
0.219 | 0.300
0.147 | 0.181
0.000 | 0.000
8peptides
spectra
0.000 | 0.000
1.000 | 1.000
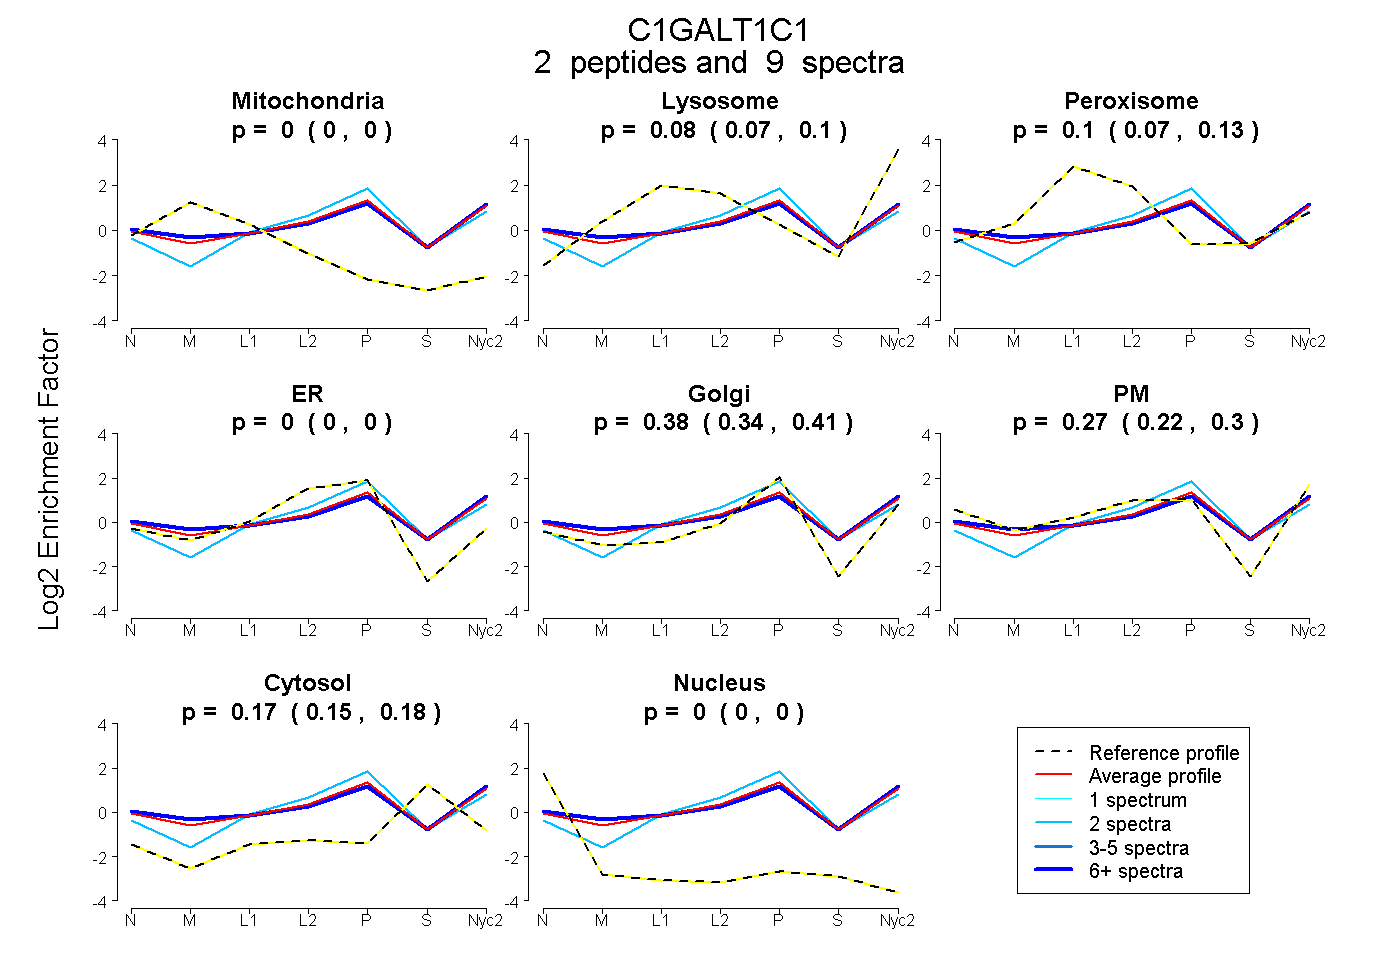
| Plot | Mito | Lyso | Perox | ER | Golgi | PM | Cytosol | Nucleus | |||||
| Expt A |
2 peptides |
9 spectra |
|
0.000 0.000 | 0.000 |
0.085 0.068 | 0.099 |
0.103 0.075 | 0.126 |
0.000 0.000 | 0.000 |
0.380 0.341 | 0.415 |
0.266 0.219 | 0.300 |
0.167 0.147 | 0.181 |
0.000 0.000 | 0.000 |
||
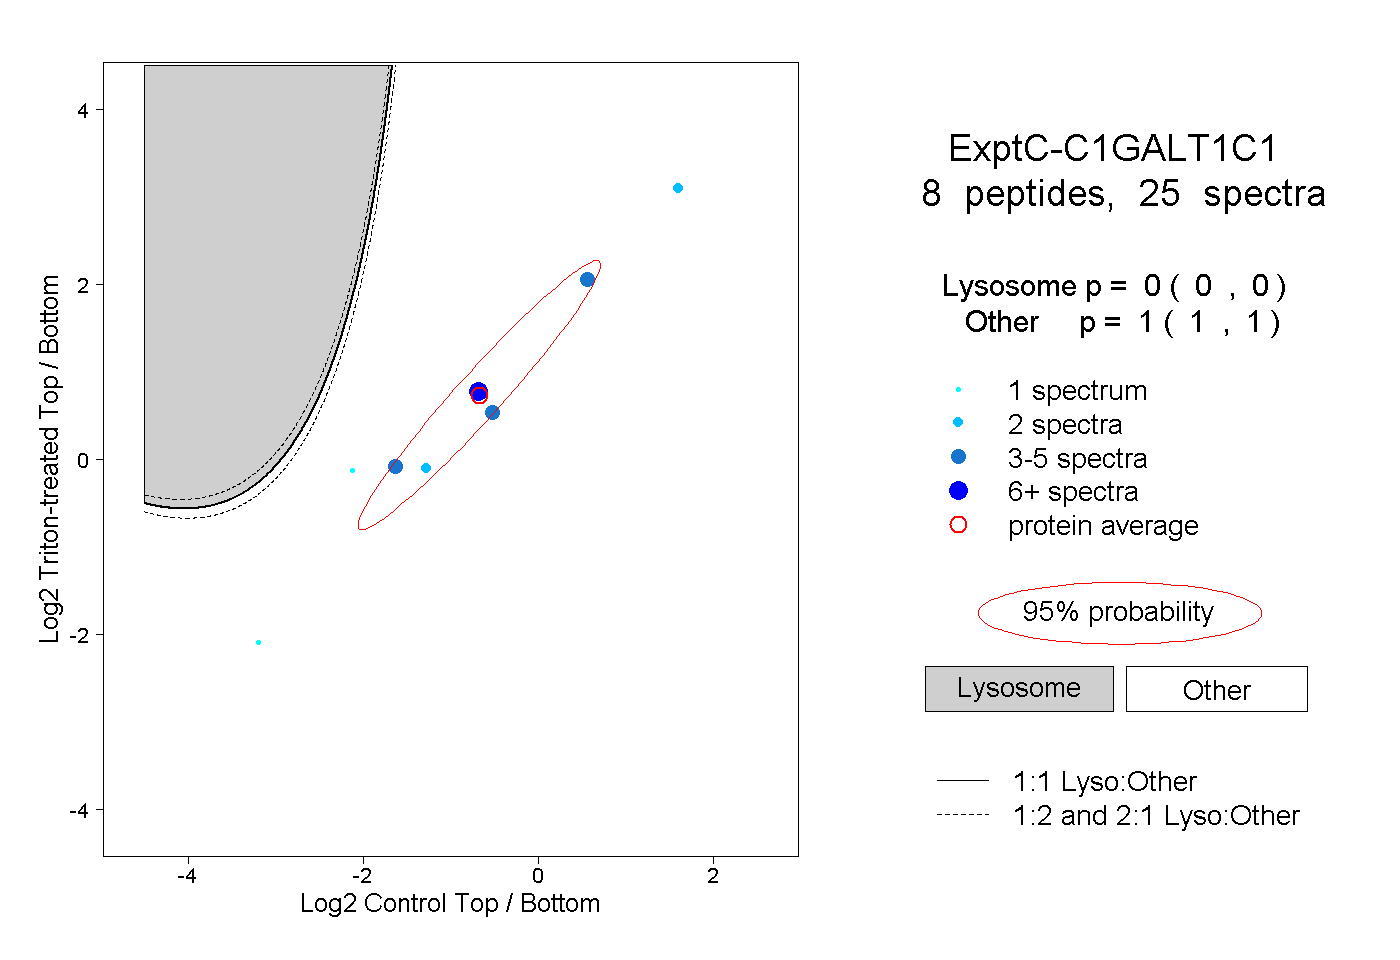
| Plot | Lyso | Other | |||||||||||
| Expt C |
8 peptides |
25 spectra |
|
0.000 0.000 | 0.000 |
1.000 1.000 | 1.000 |
| 6 spectra, SVGLFIK | 0.000 | 1.000 | ||||||||
| 1 spectrum, YAGVFAENAEDADGK | 0.000 | 1.000 | ||||||||
| 1 spectrum, DVFNTK | 0.000 | 1.000 | ||||||||
| 2 spectra, ISETER | 0.000 | 1.000 | ||||||||
| 4 spectra, QLAVCLK | 0.000 | 1.000 | ||||||||
| 5 spectra, YFLLR | 0.000 | 1.000 | ||||||||
| 2 spectra, DPSQPFYLGHTVK | 0.000 | 1.000 | ||||||||
| 4 spectra, LNGLLSVPEK | 0.000 | 1.000 |