 2
2peptides
spectra
0.000 | 0.000
0.706 | 0.891
0.000 | 0.112
0.000 | 0.000
0.000 | 0.000
0.000 | 0.145
0.031 | 0.124
0.000 | 0.025
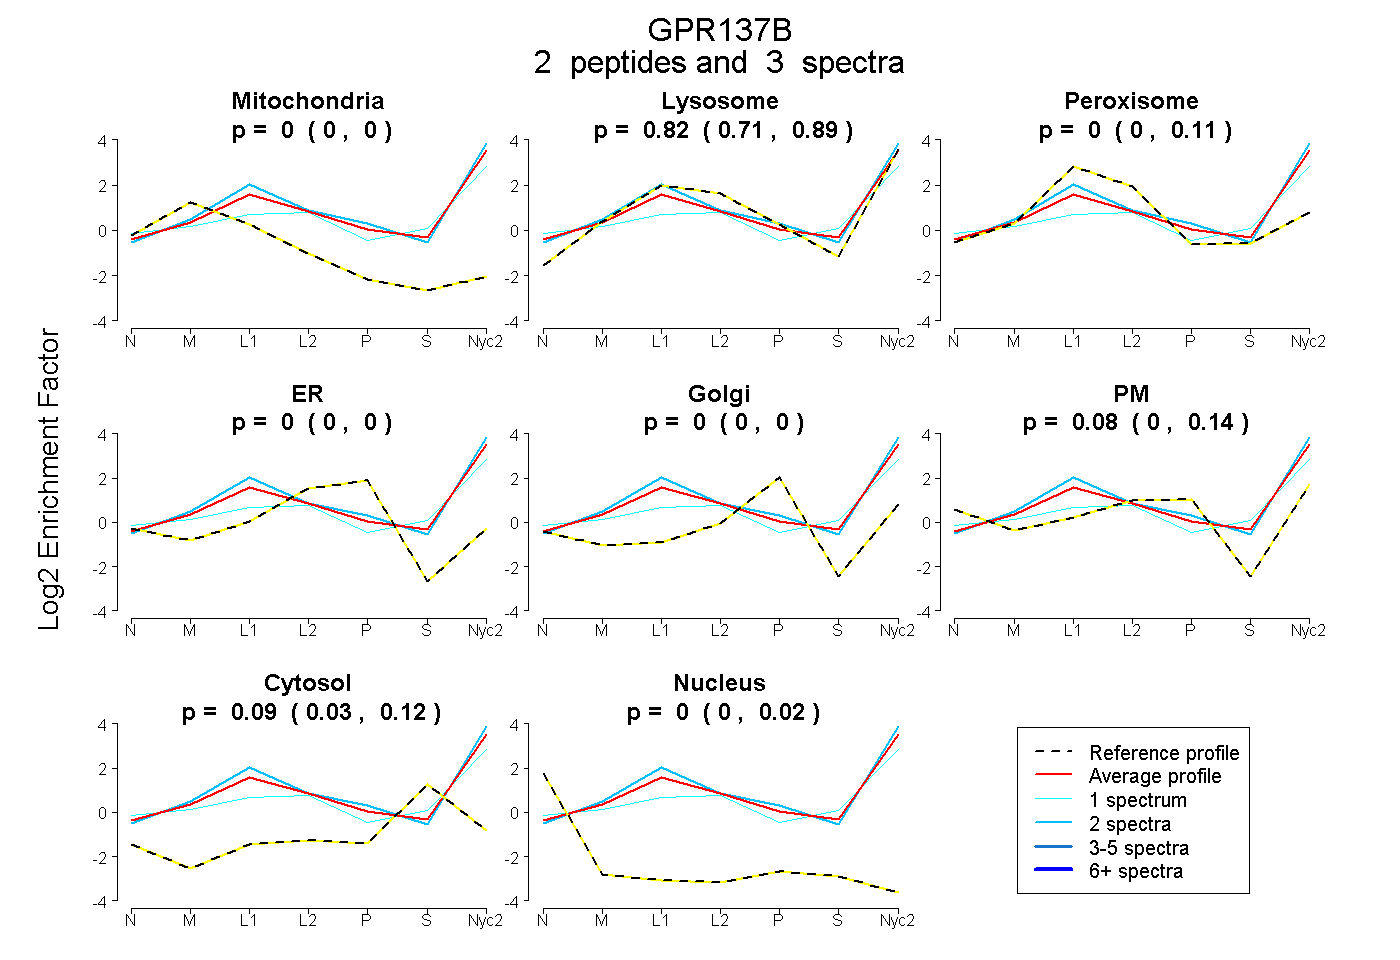
| Plot | Mito | Lyso | Perox | ER | Golgi | PM | Cytosol | Nucleus | |||||
| Expt A |
2 peptides |
3 spectra |
|
0.000 0.000 | 0.000 |
0.825 0.706 | 0.891 |
0.000 0.000 | 0.112 |
0.000 0.000 | 0.000 |
0.000 0.000 | 0.000 |
0.083 0.000 | 0.145 |
0.092 0.031 | 0.124 |
0.000 0.000 | 0.025 |
| 2 spectra, SYFFDNPR | 0.000 | 0.919 | 0.000 | 0.000 | 0.000 | 0.059 | 0.021 | 0.000 | ||
| 1 spectrum, DLTNPGMVPSHGFSPR | 0.000 | 0.622 | 0.020 | 0.000 | 0.000 | 0.127 | 0.231 | 0.000 |