 16
16peptides
spectra
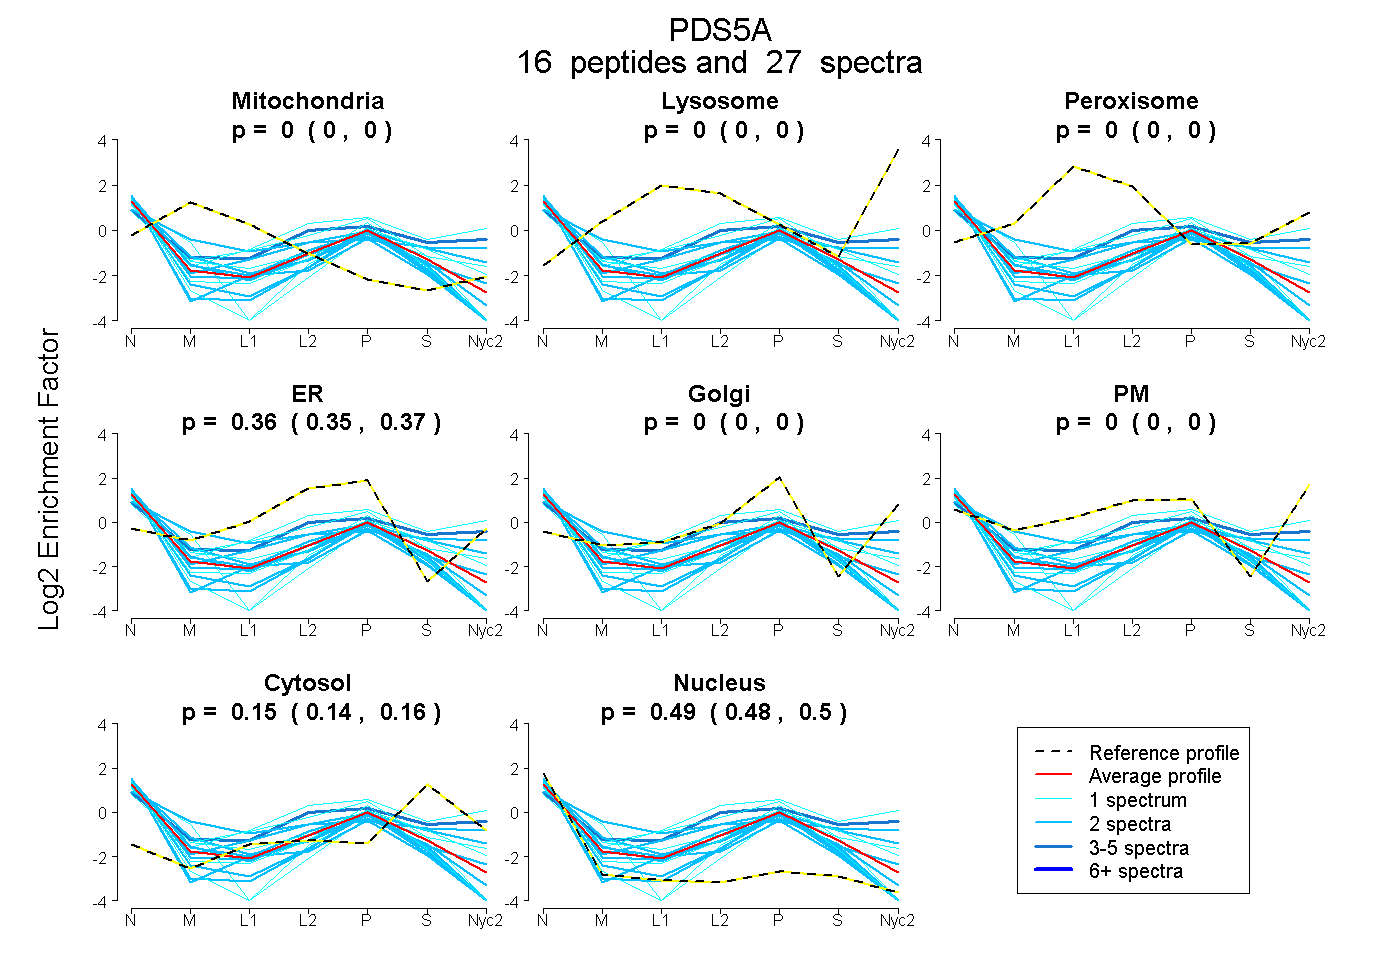
0.000 | 0.000
0.000 | 0.000
0.000 | 0.000
0.349 | 0.365
0.000 | 0.000
0.000 | 0.000
0.143 | 0.163
0.476 | 0.498
| Plot | Mito | Lyso | Perox | ER | Golgi | PM | Cytosol | Nucleus | |||||
| Expt A |
16 peptides |
27 spectra |
|
0.000 0.000 | 0.000 |
0.000 0.000 | 0.000 |
0.000 0.000 | 0.000 |
0.358 0.349 | 0.365 |
0.000 0.000 | 0.000 |
0.000 0.000 | 0.000 |
0.154 0.143 | 0.163 |
0.488 0.476 | 0.498 |
| 2 spectra, FNQVLGDDEK | 0.043 | 0.000 | 0.000 | 0.305 | 0.070 | 0.000 | 0.108 | 0.474 | ||
| 1 spectrum, QPTNPFLEMVK | 0.000 | 0.000 | 0.059 | 0.498 | 0.000 | 0.000 | 0.159 | 0.284 | ||
| 2 spectra, DIFLFITR | 0.000 | 0.000 | 0.000 | 0.221 | 0.000 | 0.000 | 0.071 | 0.708 | ||
| 2 spectra, IFAQYLVPHNLETEER | 0.166 | 0.000 | 0.030 | 0.000 | 0.000 | 0.376 | 0.261 | 0.167 | ||
| 2 spectra, EVQLAQIFEPLSR | 0.022 | 0.000 | 0.000 | 0.296 | 0.000 | 0.000 | 0.000 | 0.682 | ||
| 2 spectra, ELLDLHK | 0.000 | 0.000 | 0.000 | 0.237 | 0.000 | 0.000 | 0.070 | 0.693 | ||
| 1 spectrum, DSDLATQNRPLWQCFLGR | 0.000 | 0.000 | 0.000 | 0.087 | 0.059 | 0.000 | 0.077 | 0.777 | ||
| 2 spectra, IYAPEAPYTSHDK | 0.000 | 0.000 | 0.000 | 0.257 | 0.000 | 0.161 | 0.281 | 0.302 | ||
| 1 spectrum, STLIPILHQK | 0.000 | 0.000 | 0.000 | 0.340 | 0.000 | 0.000 | 0.030 | 0.630 | ||
| 1 spectrum, SANSTLR | 0.000 | 0.000 | 0.000 | 0.344 | 0.016 | 0.024 | 0.257 | 0.359 | ||
| 2 spectra, SQDVDQLR | 0.000 | 0.000 | 0.000 | 0.340 | 0.000 | 0.000 | 0.096 | 0.564 | ||
| 1 spectrum, AQDFVK | 0.000 | 0.000 | 0.000 | 0.239 | 0.000 | 0.000 | 0.113 | 0.648 | ||
| 2 spectra, IETDLPQIR | 0.000 | 0.000 | 0.000 | 0.331 | 0.000 | 0.000 | 0.026 | 0.643 | ||
| 1 spectrum, QAVHCIHAIFSNK | 0.000 | 0.000 | 0.000 | 0.127 | 0.000 | 0.452 | 0.368 | 0.053 | ||
| 3 spectra, DAQSPDEAK | 0.000 | 0.000 | 0.000 | 0.120 | 0.000 | 0.399 | 0.336 | 0.146 | ||
| 2 spectra, GTPHQAK | 0.000 | 0.000 | 0.000 | 0.336 | 0.000 | 0.000 | 0.016 | 0.648 |
| Plot | Mito | Lyso or Perox | ER | Golgi | PM | Cytosol | Nucleus | ||||||
| Expt B |
1 peptide |
1 spectrum |
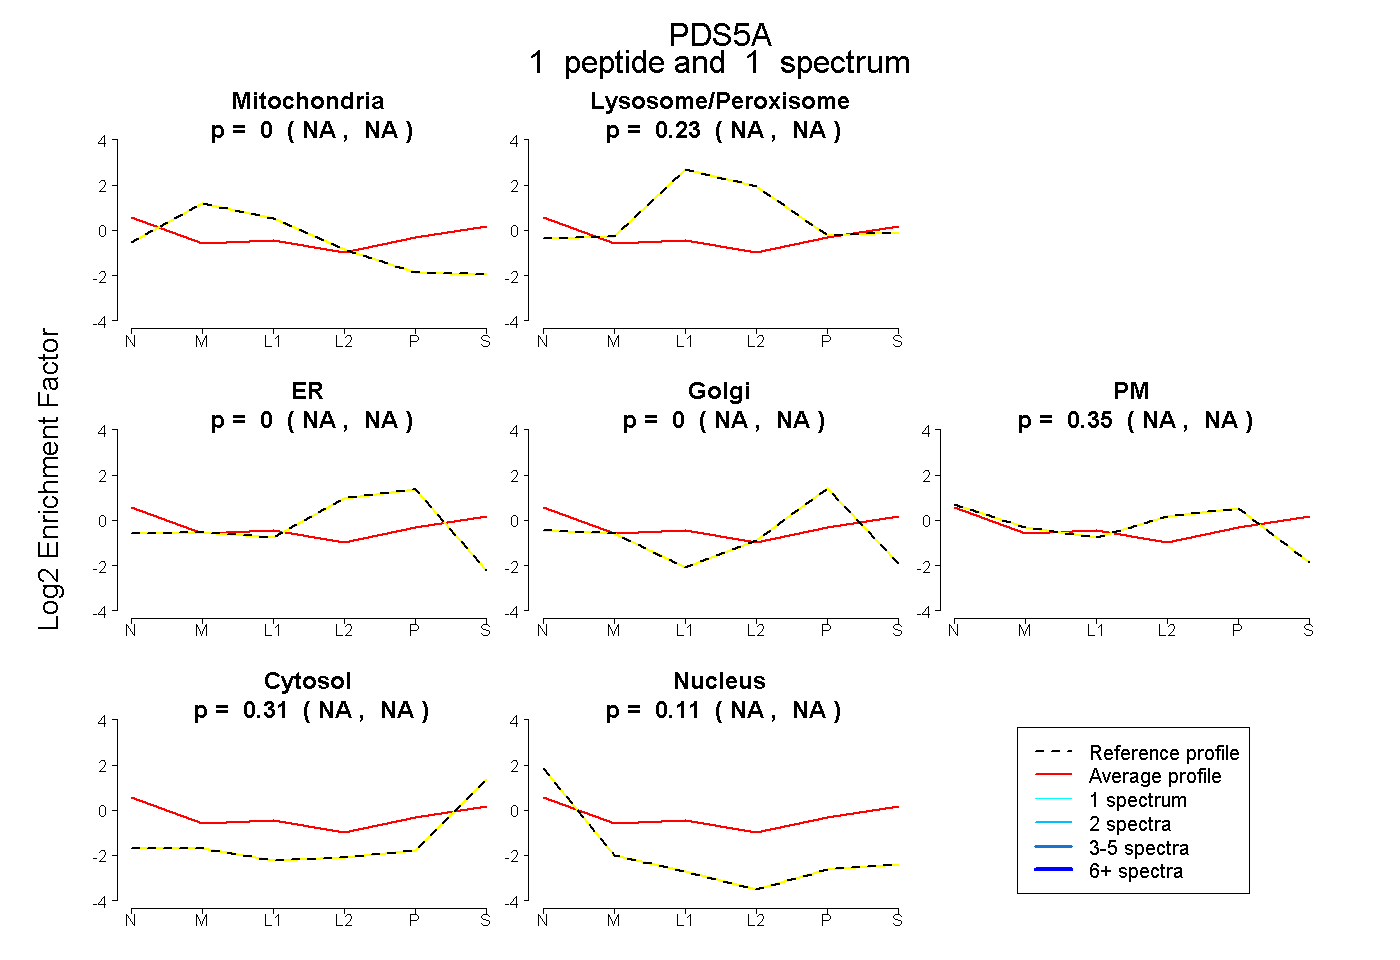 |
0.000 NA | NA |
0.230 NA | NA |
0.000 NA | NA |
0.000 NA | NA |
0.350 NA | NA |
0.307 NA | NA |
0.112 NA | NA |
|||
| Plot | Lyso | Other | |||||||||||
| Expt C |
4 peptides |
17 spectra |
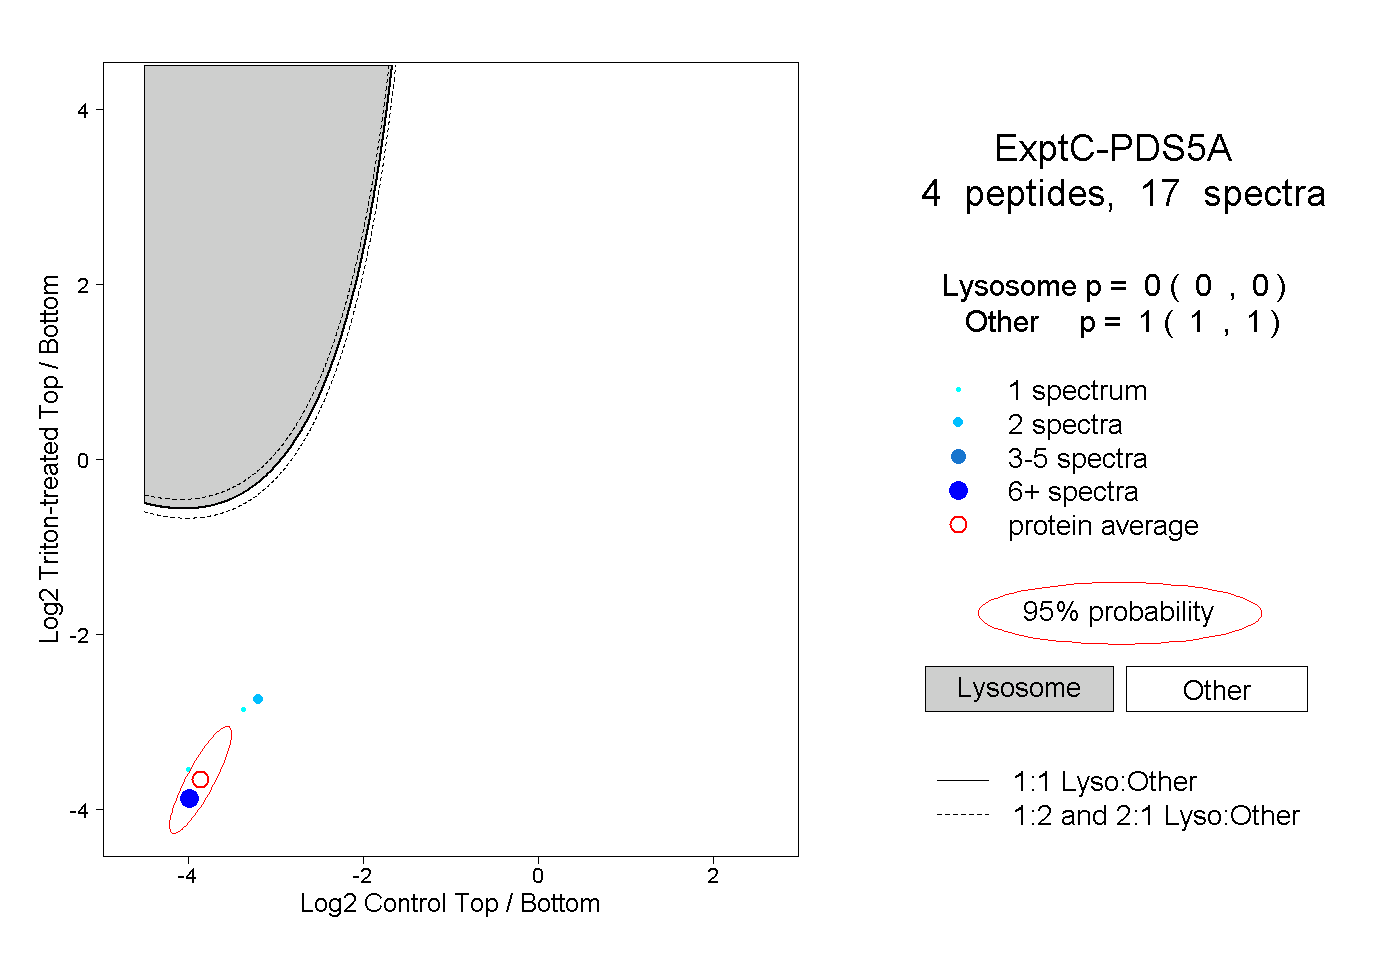 |
0.000 0.000 | 0.000 |
1.000 1.000 | 1.000 |